
Many of you have asked me what is the best stack to do Analytics for SEO.
The answer is quite straightforward as the problems we face are always the same, and thus the tools we can use.
You are free to experiment and test new tools but the important is realizing that they are simple means to an end.
So here is my personal compilation of tools/solutions to build the definitive SEO Analytics stack for any type of website.
Table of Contents
The Tools
You can use what you want but there are some mandatory requirements:
- Google tools like GSC and GA4
- A crawler
- Keyword data
- Backlinks data
- An LLM tool like Claude Code
The rest is open to discussion but this is the minimum viable stack you need.
If you work on advanced projects, you have probably met data professionals who use some of the tools mentioned in this post.
Don’t worry, most of them are easy to learn and you can get a lot done even with the help of ChatGPT!
Google Search Console
This shouldn’t be a secret, Google Search Console is the ultimate tool for getting 1st party data and is free.
Even though it looks like you don’t get much SEO data, it’s a goldmine in the right hands.
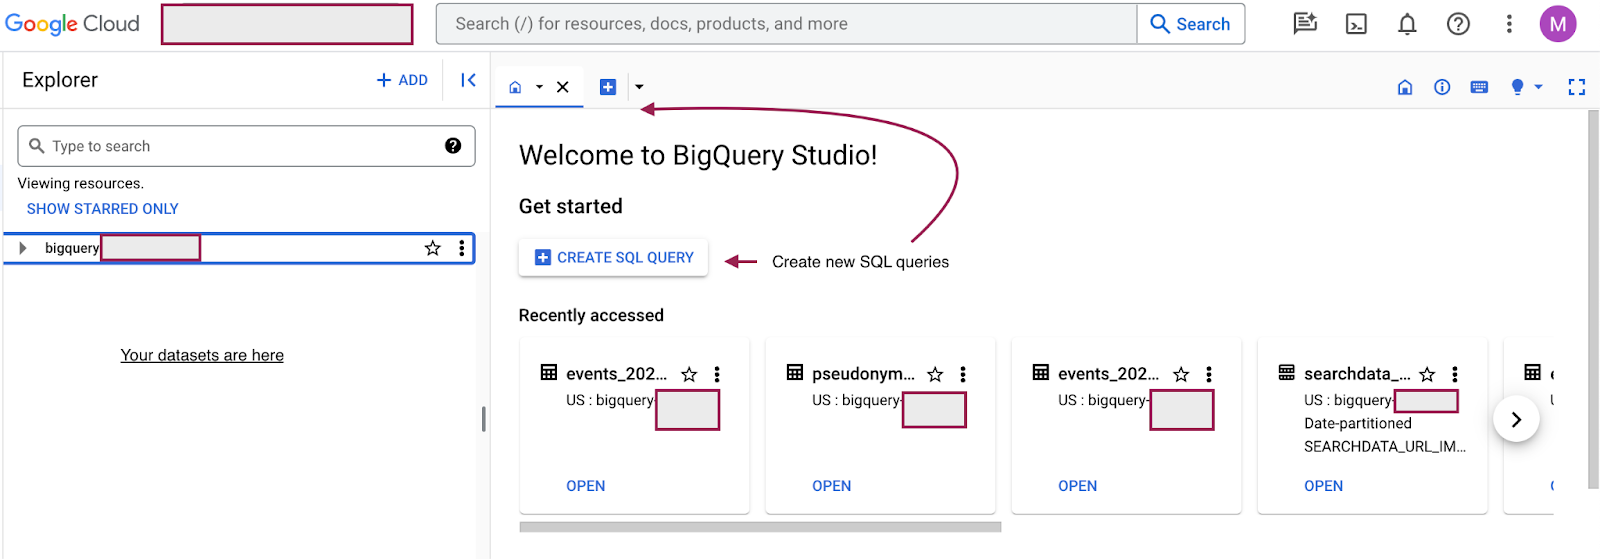
By using the BigQuery Export, you can get the most data, a lot more than the tool itself, as explained in my dedicated article.
The API is to be used when you need to do historical analysis and you just setup BigQuery.
It’s the main way to assess organic success and the best companion for every content website since it contains query data.
You may also use the following Google Sheets extension below to get the API data:

If you are like me, you’d rather use a library in R/Python to do it, as explained in one of my articles for OnCrawl.
But not only that, you can also calculate custom metrics, such as:
- Unique Query Count
- Content Decay
- Page Groups
And if that weren’t enough, the use of pivot tables unlocks new ways of looking at your data in a few seconds.

If that weren’t enough, you can now export your daily GSC data to Google BigQuery with some clicks and a guided procedure.
There are noticeable discrepancies between the UI, the API and the Bulk Export in BigQuery.
This is a topic for another time but you must know these key discrepancies.
A Crawler (Screaming Frog/Sitebulb/alternatives)
Crawl data are crucial to get info about internal inlinks and outlinks. This information allows you to see which parts of your website are unserved and can be connected to others.
As you may already know, internal linking is an important factor for your website, because it can improve rankings.
Not only that, but it also helps users and bots navigate your website.

In general, you should always have a crawler/scraper to extract info from a website since some of your analyses may include specific requests.
If you have to extract the category from pages, you need to scrape the website and ask for that element.
Having access to an additional level of classification can make a huge difference in your analyses.
What I always get is:
- Any info about links
- Tags/Categories obtained via Custom Extraction
- Status codes
- etc.
You don’t even need to use tools for some scraping tasks… advertools is a great Python library to save a lot of technical headaches.
If you want to just scrape content and get it ready for LLMs, crawl4ai is a solid Python library to do that at scale.
Coding (SQL/Python/Javascript/R)
Analytics doesn’t always require you to code but… coding helps a lot and is a requirement for many projects.
Now with LLMs like Claude this is trivial as you can pretty much code whatever you want.
The most common cases where coding is required are:
- Big datasets
- You want to automate the process
- Someone else needs to work on it
- Advanced use cases where you need complex models
This is where R, Python and SQL kick in, replacing spreadsheets and providing a good way of automating work.
Did you ever see the Excel warning that you have too many rows? Easy peasy, switch to R/Python/SQL and enjoy the newfound speed.
Most of the SQL work takes place in BigQuery, which will see in a moment.

For more advanced use cases, coding is the only necessary solution as you get more freedom and a lot of customization options.
Let’s say you want to create a custom formula to score content decay.
In Excel, this would take many steps and be hard to reproduce, with code you have many options to speed it up and build it.
I go over the main differences between the 2 languages in my ebook.

If working with BigQuery, which is ideally what everyone should do, you would write SQL or export your data via a Python library like Polars or DuckDB.
SQL is the lingua franca of data and what you should learn eventually!
Javascript also has its solid use cases for:
- data visualization, currently has the best capabilities
- for Dataform and Google Tag Manager
Google Analytics 4
GA4 is the must for Analytics because you can’t just analyze SEO data and call it a day.
You need to report on events, e.g. conversions, and not just clicks because that’s what matters for a business.
Google Analytics allows you to track conversions and leaves room for a lot of customization.
The interface is mediocre and confusing though, this is mostly why you should once again use the BigQuery export.
But unlinke GSC, the export gives you so MUCH more freedom and data, as explained in this article.
Many businesses stick to standard metrics and dimensions, so it could be hard to get some ROI out of this tool.
This is why SEO Analytics per doesn’t exist, the business comes first and marketing follows.
You first need to define or figure out which events matter for your business.

Nonetheless, GA4 can be used to expand your analyses to other marketing channels and is quite useful during content audits.
A page with 0 clicks in Search Console may have some traffic from other channels.
This piece of information allows you to prevent disasters, like pruning pages that people actually visit.
Data Storage (Google BigQuery or alternatives)
Processing data is cool but what about storing it? You can’t always read data from CSV files or use APIs, you need storage at some point.
Google BigQuery is the most common industry solution due to the ease of integration with other Google tools/APIs.
It’s part of the Google Cloud Platform suite of tools.
Google literally forces us to use the GA4 and GSC exports because they provide unique data.
You are forced to go through BigQuery and only after, you can move your data to another warehouse.
Storing Search Console data is the most prominent example because it can only display the last 16 months, meaning that the rest will be deleted at some point.
Thanks to the Bulk Export, you can have automatic exports from GSC to BQ.
Do you know how much work and setup it required before? This is the savviest move by Google so far.
Data storage protects you from this scenario and allows for easy retrieval when you need it.
The other reason is to join your data in one point instead of pulling them all every time and then combining them.
In most enterprise situations, you won’t be able to use Google solutions because deemed “not safe” in terms of privacy.
I have released a Free BigQuery Handbook that my newsletter subscribers get for free (1 hour after subscribing):
Using other cloud platforms such as AWS or Azure shouldn’t be a problem either.
The point here is to pick OLAP-friendly solutions, namely databases that can handle analytical tasks with ease.
While some claim that BigQuery is “expensive”, this can’t be further from the truth.
Cloud solutions like Google’s allow every business to store its data, in fact here is what I paid for a relatively small Ecommerce:

Data Visualization Tools
One of the last steps of a data project involves visualization.
We are highly visual animals and what’s the best way to showcase our results? Shiny plots and cool formatted tables with the right fonts!
Tools such as Looker Studio, Tableau, PowerBI and Qlik are must-have solutions for an Analyst.
If you can’t effectively communicate your results, your SEO project will be a failure. The same applies in other industries when dealing with data.

Some principles apply since this is both an art and a science. For instance, you should use accessible colors and be sure that your points emerge from the plots.
In the SEO industry, Looker Studio is the de facto standard due to its simplicity and pricing (it’s free).
Google released a Pro plan that allows you to get access to new features such as team collaboration and automated report delivery.
I have had some traumatic experience with tools like PowerBI which I deem too complex and would avoid, seriously.
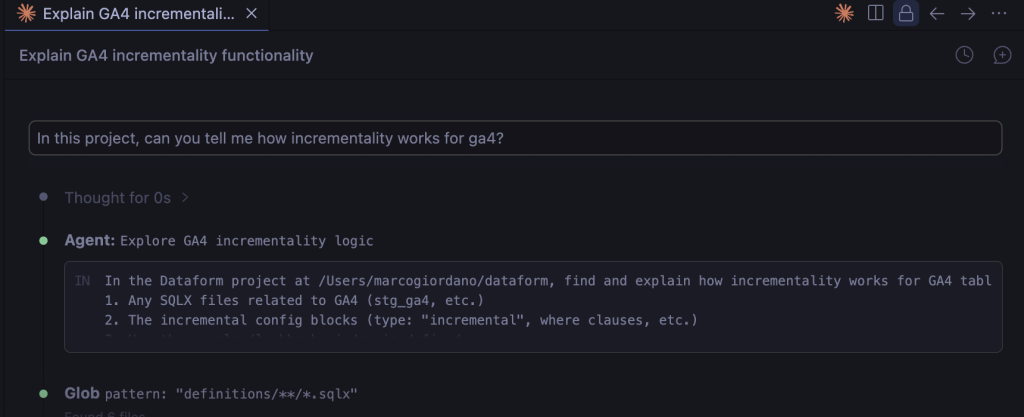
Claude Code (or LLMs in general)
This is the turning point of any digital job, as I explain in my article about LLMs for Analytics.
Claude Code extends your technical capabilities by helping you to write code and prepare plans for your tasks.
Despite the name, it’s not only for coding!
You can run it from your terminal or IDE like I do:
The real struggle people have with AI is productivity. Too much information doesn’t lead to more action or better decisions.
This is why you should decide in advance what’s your use case and then use Claude Code to help you with it.
Gephi: Visualize Links
Gephi is a popular choice to visualize the links structure of your website and is one of my favorite tools.
If you are familiar with the basics of Graph Theory, Gephi is a must-have for many technical/analytical projects.
Once you get the list of links of a website, for example from Screaming Frog exports, you can build visualizations like the one below:

These plots are cool to look at but are also extremely practical if you know how to interpret them.
Pages in the same clusters should have a defined pattern, e.g. similarity, or else it means you have to review your internal linking.
The same process can be applied to competitors to see how they link articles and as a way to navigate larger websites.
Coding For Plotting
You don’t have to pay for a visualization tool if you know how to code (at least for some use cases).
There is no doubt that tools like PowerBI and Tableau are excellent and they integrate well with code but…
sometimes you just want to build a web app or something else.
R, Python and even D3.js, a Javascript library, are among the best picks for this.
If you are serious about DataViz, go for R and JS, don’t even bother with Python.

The example above should convince you that coding gives you a lot of freedom and it’s extremely useful for plotting distributions.
If you are tired of being limited by a UI, you should definitely switch to code and write your own plots.

The example above shows the performance of 3 clusters in terms of % of total clicks.
Carrying out a task like this with code is easier because you have absolute control over your output.
Cloud Platforms
For large projects, you can’t rely on your laptop to save data and you need an actual solution.
Cloud platforms offer the best trade-off for our needs and are part of many companies’ stacks anyway.
The most optimal choice is Google Cloud Platform since the majority of SEO work happens with Google tools and APIs.

The reason why you use cloud is not because you like spending money… it’s because you want to scale and ensure data is safe.
You can schedule functions, ingest data, create entire workflows, build dashboards and send notifications. Anything is possible as long as the data is good and makes sense.
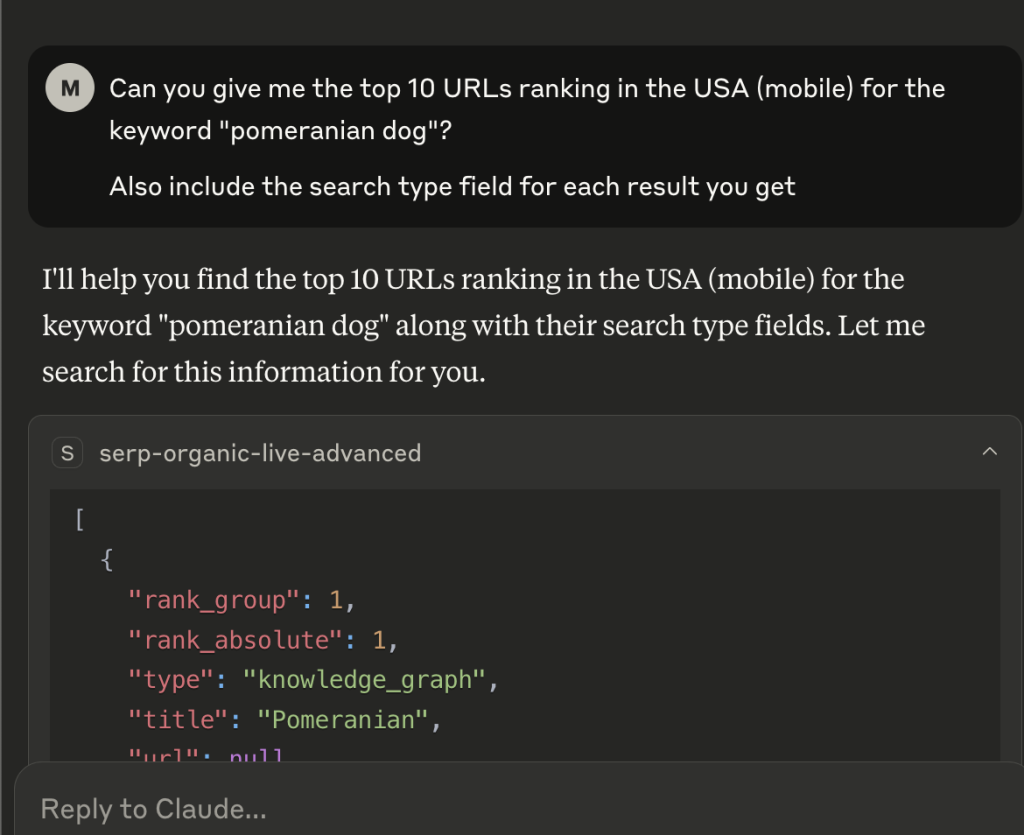
A SERP API
Scraping SERPs is important for many reasons, one of them is research.
Nowadays, you have tools that use SERP APIs under the hood without you knowing. For many SEOs, this is the best choice because it makes your life much easier.
If you are among the technical crowd, you can consider many options, such as:
- Data For SEO
- ValueSERP API
- SERP API
What to say, pretty much anyone can create their SERP API and sell it.
As of 2026, I rely on DataForSEO because it’s accessible in terms of pricing and well documented.
Plus, I worked on keyword clustering with DataForSEO data so you can do the same.
For checking your rankings, you can use Google Search Console but as shown in my other article about GSC data, they are not what you think.
Instead, I’d recommend you score the pixel ranking, namely how much space your result is occupying in the SERP for a keyword.
Ahrefs/Semrush/Majestic/Others
Links data can be invaluable and give you important information when auditing content.
Unfortunately, there aren’t many alternatives available and you are left with paying for these tools in many cases.
Many SEOs often misuse them and replace GA4 or even worse GSC data with fancy 3rd-party metrics.
Please, don’t do it, be reasonable and use these tools only for the exclusive information they have: backlinks.

The only reason why I am including them here is that they get you to backlinks data and may be good for getting the intent of keywords or SERP features.
The most reasonable choice would be to pay for the APIs… but they are super expensive.
For this reason, I only recommend using these tools for decently large Analytics projects.
Otherwise, you can use Bing Webmaster Tools (BWT) that unlike Google Search Console gives you better backlink data and even competitor intel.
Airtable
I’d be stupid for not recommending Airtable, the best solution to craft content plans and most importantly, get additional data.
Airtable is the perfect mix of a spreadsheet and a database and is capable of extensive automation with the help of Make and Zapier.
Do you want your BigQuery data there? You can!

Need to send notifications to specific people? That’s possible!
I am amazed how such a great tool is relegated to content plans and never discussed in the SEO community for technical topics.
Google Sheets/Excel
Spreadsheets play a key role in data even after all these breakthroughs and you need some basic level of confidence with them.
Personally, I am not that good in Excel or even Google Sheets but I still use the latter to do basic analysis and color nice tables.
With Claude, you are even luckier as you can just ask for some AppScript code without even knowing it.
Sample Workflows For Any Website
Showing you a stack without some examples of what you can achieve with it would be a waste of potential.
These are only some examples based on my personal experience, you can do much more depending on your use case.
Most of the concepts I mention here are tied to my Content Auditing Framework, my reference when auditing websites.
As always, if you want to create an actual software or data pipeline, you need support from engineers and IT/data professionals.
P.S. I’ve already summarized 3 of these workflows in the picture below:

Workflow 1: Content Optimization

Content Optimization is crucial to ensure you survive and get traffic after years.
I follow these 2 flows after cleaning and processing the necessary data (often GSC/GA4/SF).
Decaying pages are a real danger for many websites because many business owners don’t track them but would rather analyze GSC data once in a while.
The same goes for evergreen content, you first need to identify them and then work to improve them.
Workflow 2: Cloud Automation
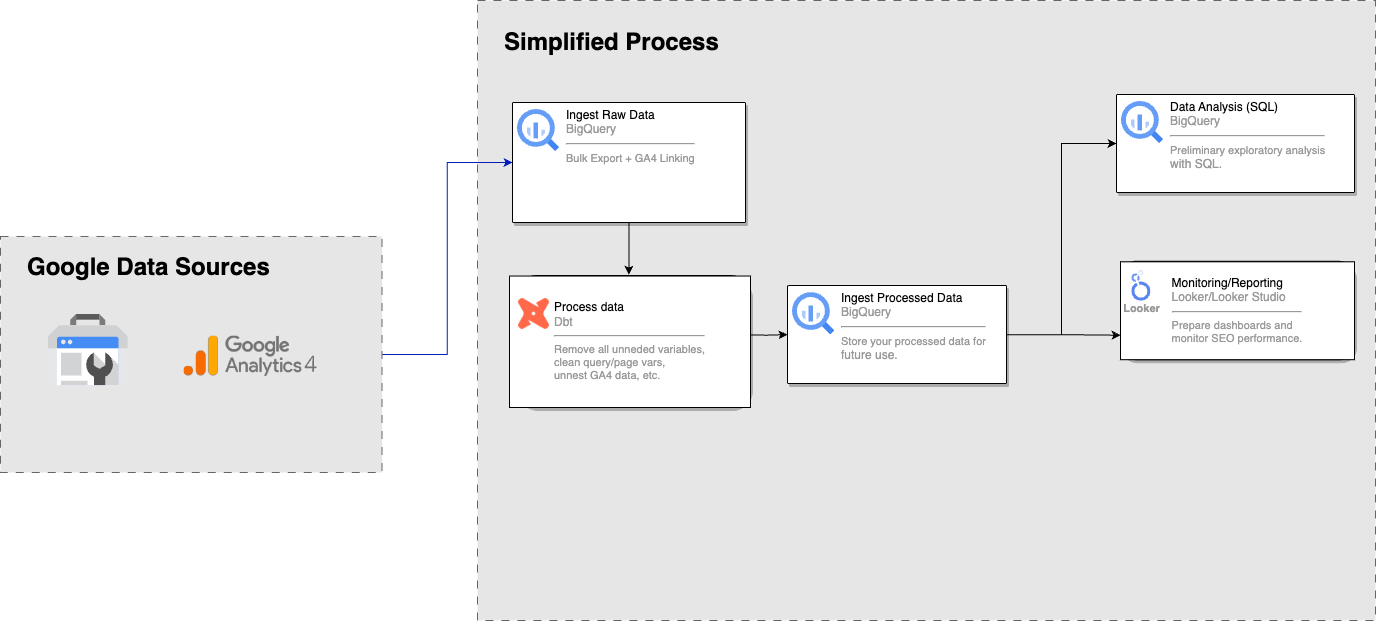
More advanced projects require decent automation, to say the least.
The example above shows what I mean and should be on your radar if you are tired of crunching reports and also want notifications.
It takes data from GSC/GA4 with direct connectors to BigQuery.
Then, you can load your data in Dataform/DBT and ingest them again in BigQuery.
Dataform is free and integrated inside BigQuery, so it’s the better choice if your project only involves web data.
Otherwise, you need the more flexible DBT that is NOT exclusive to Google Cloud and BigQuery.
DBT is a great tool to do so that garnered a lot of popularity since its release.
In plain English, it’s a data transformation tool based on SQL.
In practice, reality is more complex than that and there is no absolute solution.
Each case is different and I recommend you work with data engineers before venturing into this.
Workflow 3: SERP Research + Entity Analysis

SERP Research is the most underrated process out there. Many open their favorite keyword research tool, check some SERPs and call it a day.
Actual market analysis goes through SERPs and the best way to explore them is to use a SERP API.
With that in mind, you can learn how to do a proper analysis instead of simply clustering keywords (which is still cool and fine).
SERP Research opens the door to many possibilities, for example extracting the entities in the texts or just saving the title tags for comparisons/n-gram analysis.
Workflow 4: Keyword Research

Keyword Research is an art but most of it you can automate.
You have a lot of data sources out there, including forums and even social media data.
I always recommend combining traditional sources with the others I mentioned to have a more complete picture.
Once you have unified and cleaned the data, you can do SERP Clustering with your favorite tool (or an in-house build).
What you get is one page per group of keywords which can be used as the input for briefing with an AI script.
The last automation is to push your articles to Google Docs or directly to your CMS as drafts.
Workflow 5: Tagging Pages

Many websites have chaos, they don’t know which page belongs to which group, making your SEO work harder.
The solution is to tag these pages and assign them to one or more groups.
Once they are grouped, you can analyze their performance.
If you are lucky, you will have labeled data available or a good tagging structure in their CMS.
This isn’t often the case and that’s why we recur to different approaches, such as:
- Fuzzy Matching – by pattern
- Clustering – the machine will find the groups for you
- Rule-based approach – based on rules and conditions
- Ask LLMs to do it for you – can be risky but quite good if done properly
This is one of the most frequent problems for publishers and large content websites.
Prevention: use Airtable to do it from scratch. New websites with labeled data are a joy to work on.