

There are several ways to access Google Search Console data: UI, API and BigQuery Bulk Export.
All of them use different criteria to sample and aggregate data, causing discrepancies and results that don’t always match.
You should be able to know and explain ALL the discrepancies across the 3 data sources for the success of your Web Analytics project.
Business-wise, what matters is that you take good decisions and the best potential candidate is BigQuery.
Table of Contents
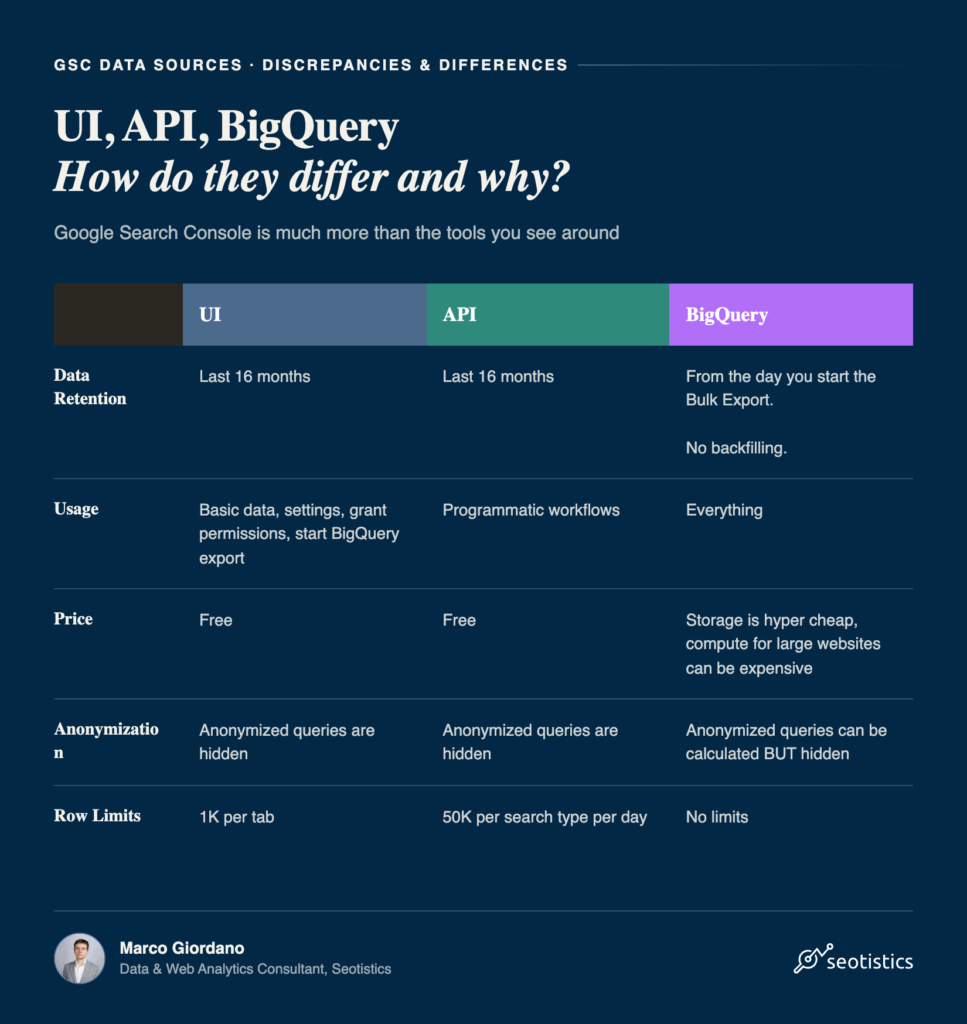
The 3 Data Sources
As of today, there are 3 ways to interact with GSC data:
- The tool itself (referenced as UI in this article)
- The API (programmatically retrieve data)
- BigQuery export (the best way and the one for serious projects)
Data Studio allows you to connect to the API data directly and 99% of the MCPs you see around use the API as well.
The difference is that DS also has a BigQuery or warehouse connector so that you aren’t forced to use the (limited) API option.
Quantifying The Discrepancies
In this section I am using real data from websites that I can’t mention due to privacy or secrecy.
Showing some data was hard and nearly nobody shows it for a sample of enterprise websites. For this reason, I wasn’t able to actually get all the necessary data!
N.B. For the API data, I am always comparing for aggregation by site, not URL. The UI numbers are by definition aggregated by site too.
Let me show you actual data from a small website comparing all three sources for the same date range and for WEB only:
| Metric | UI | API | BigQuery | Notes |
|---|---|---|---|---|
| Clicks | 1,100 | 1,100 | 1,101 (site) VS 1,112 (url) | Almost the same |
| Impressions | 196K | 196K | 195,735 (site) VS 204,743 (url) | Almost the same |
| UQC | Capped to 1,000 | Capped to 50K rows per day per search type | 1,658 (site) VS 1,658 (url) |
As explained in my article about GSC dimensions and metrics, Avg. Position and CTR are calculated after impressions.
So those metrics will be wildly different too.
Now let’s consider an enterprise website:
| Metric | UI | API | BigQuery | Notes |
|---|---|---|---|---|
| Clicks | 27.2M | Couldn’t retrieve. | 25,613,602 (site) VS 26,128,533 (url) | Almost the same |
| Impressions | 473M | Couldn’t retrieve. | 445,980,315 (site) VS 825,331,994 (url) | Even higher in BQ. Here the diff. between site and url is crystal clear. |
| UQC | Capped to 1,000 | Capped to 50K rows per day per search type | 3,123,873 (site) VS 3,100,995(url) |
And what about this other enterprise website:
| Metric | UI | API | BigQuery | Notes |
|---|---|---|---|---|
| Clicks | 1.95M | 1.95M | 1.99M | Almost the same |
| Impressions | 162M | 161.7M | 243M (URL only) | Even higher in BQ. |
| UQC | Capped to 1,000 | 81K | 988K | What to say here… |
Or this other enterprise example:
| Metric | UI | API | BigQuery | Notes |
|---|---|---|---|---|
| Clicks | 86.1M | 99.8M | 25,613,602 (site) VS 26,128,533 (url) | Almost the same |
| Impressions | 2.08B | 1.84B | 445,980,315 (site) VS 825,331,994 (url) | Even higher in BQ. Here the diff. between site and url is crystal clear. |
| UQC | Capped to 1,000 | Capped to 50K rows per day per search type | 3,123,873 (site) VS 3,100,995(url) |
Given all these examples, it’s clear that the following considerations apply:
- Clicks remain consistent across all three sources (they’re not anonymized)
- Impressions inflate dramatically as you get more complete data
- BigQuery includes a great % of anonymized queries that are invisible in UI/API
- Most of your pages don’t appear in UI data at all
Even though I wasn’t able to get the number of unique queries for some websites, you can clearly see that for on the difference is HUGE.
From 81K to 988K is more than 10x.
If you open your Google Search Console, it’s quite common to see a scenario like this one:
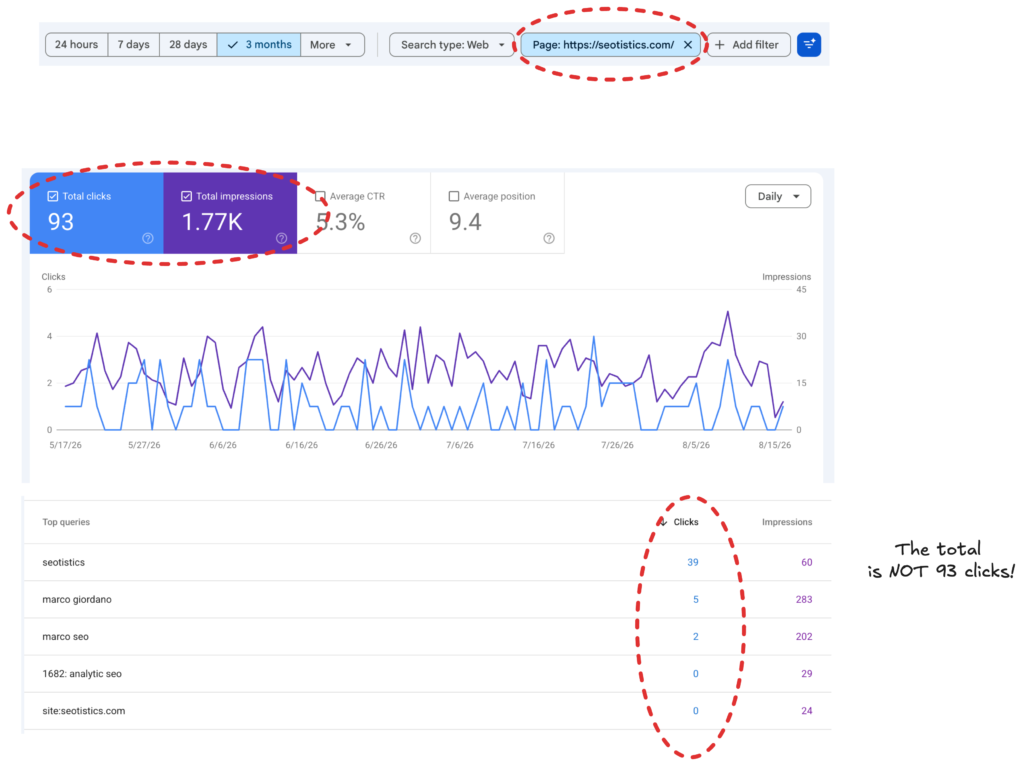
The missing numbers derive from anonymized queries, reported in BigQuery only but still hidden to us.
As we will see in the next section…
Anonymized Queries & Their Impact
Google anonymizes search queries with low search volume to protect user privacy. This is especially true for:
- Queries with very few searches
- Queries that might identify individual users
- Long-tail variations with minimal volume
I noticed that Bing Webmaster Tools doesn’t do the same and this is why it’s a great addition in your quest for search data.
UI/API: These queries are completely excluded
BigQuery: These queries are included with is_anonymized_query = TRUE
In BigQuery, you can run a query like this to calculate the % of anonymized queries you have:
SELECT
   (COUNT(CASE WHEN is_anonymized_query = TRUE THEN 1 END) * 100.0 / COUNT(*)) AS percentage_of_anonymized_queries
FROM `project_name.dataset_name.searchdata_site_impression` -- or url_impression
WHERE search_type = 'WEB' -- if only search tab in Google
I recommend using the site table instead of the url table.
The impact of anonymized queries can be higher than 80% of your total data, as said often elsewhere.
Row Limits
The biggest downfall of GSC is that the tool is hyper limited in terms of rows.
UI Limit:
- Hard cap at 1,000 rows per tab
- No workaround
- Data is sampled/truncated
Which means you literally see up to row #1000, nothing more.
The API doesn’t help either because it’s also limited by rows and it’s a little bit trickier.
API Limit:
- 50,000 rows per request per search type per day (source: Google Search Console API documentation). Actually, 25K rows, then you have to paginate…
- Extracting data for big projects becomes a full-time engineering project
And even so, you’d need to understand the limits and the fact that if you request different dimensions, you will get different results:
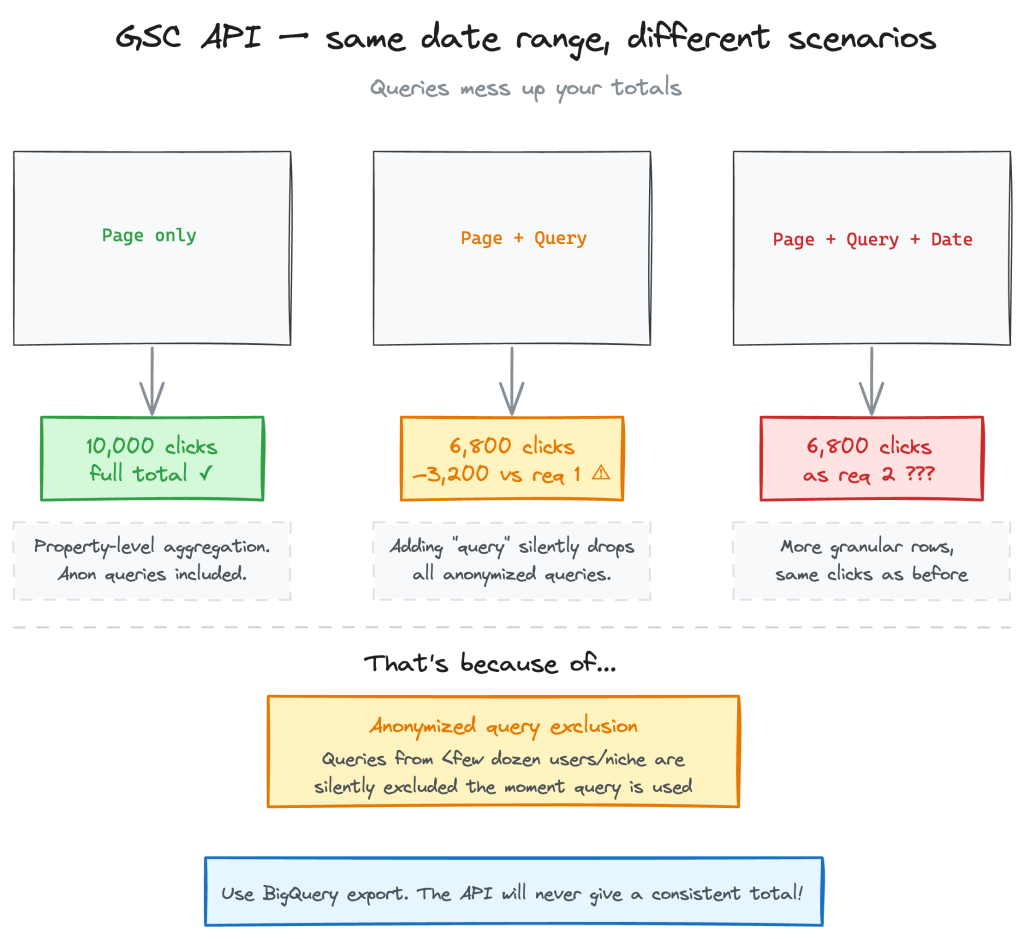
The easiest and most complete solution is once again BigQuery:
BigQuery:
- No row limits
- Bulk daily export
- Complete data in one table
This is what causes the biggest mismatches or misunderstandings.
Date Range and Data Retention
The 3 options also have different data retention, i.e. how long they store your data.
The UI and the API can go back until 16 months from today, whereas BigQuery has no hard limit.
If you need historical trend analysis beyond 16 months, BigQuery is your only option.
The real downside of it is the absence of backfilling that the API can have (always up to 16 months).
The Site vs URL Table Trap
BigQuery exports GSC data into two separate tables and understanding the difference is critical.
If you compare impressions, you can often notice that you are wildly off simply because you are using the wrong aggregation.
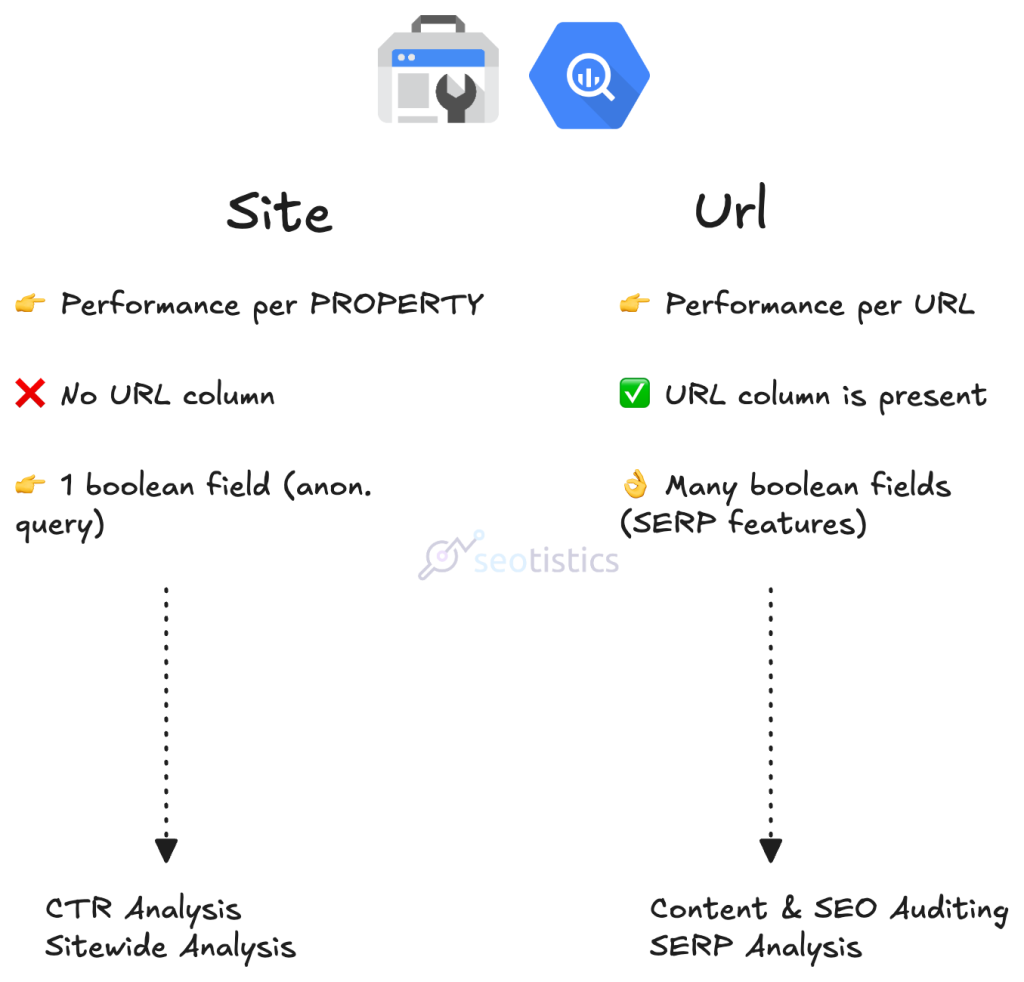
searchdata_site_impression (Site Table)
This table is to be used for property-wide analyses and CTR estimation. You won’t use it often for most SEO analyses, though.
- Uses properties as the reference
- If multiple pages rank for the same query, counts 1 impression total
- Does NOT include the
urlfield - Useful for domain-level overviews
- Better for CTR analysis (avoids impression inflation)
searchdata_url_impression (URL Table)
This is the true star of SEO and the most useful table in general.
- Uses URLs as the reference
- If multiple pages rank for the same query, counts 1 impression per page
- Includes the
urlfield - Essential for page-level analysis
- Inflates impressions when multiple pages rank
Real example:
Query: “best running shoes”
Your site has 3 pages ranking: /running-shoes, /best-shoes, /shoe-reviews
Site table: 1 impression
URL table: 3 impressions
For the same search, you get 3x the impressions in the URL table!
Which Table Should You Use?
| Analysis Type | Table to Use | Reason |
|---|---|---|
| CTR calculation | Site table | Avoids impression inflation |
| Content audits | URL table | Need page-level granularity |
| Identifying ranking pages | URL table | Need to see which URLs rank |
| Domain visibility | Site table | Accurate impression count |
| Keyword research | URL table | See all page-query combinations |
Why Combining API + BigQuery Data Destroys Your Analysis
Someone starts BigQuery export today, realizes they don’t have historical data and tries to “backfill” by combining API historical data with current BigQuery data.
DO NOT DO THIS.
Unfortunately, BigQuery doesn’t allow you to backfill your data so many think you can simply store your API data and combine them with the exports.
The 2 datasets are completely different and can’t be compared directly.
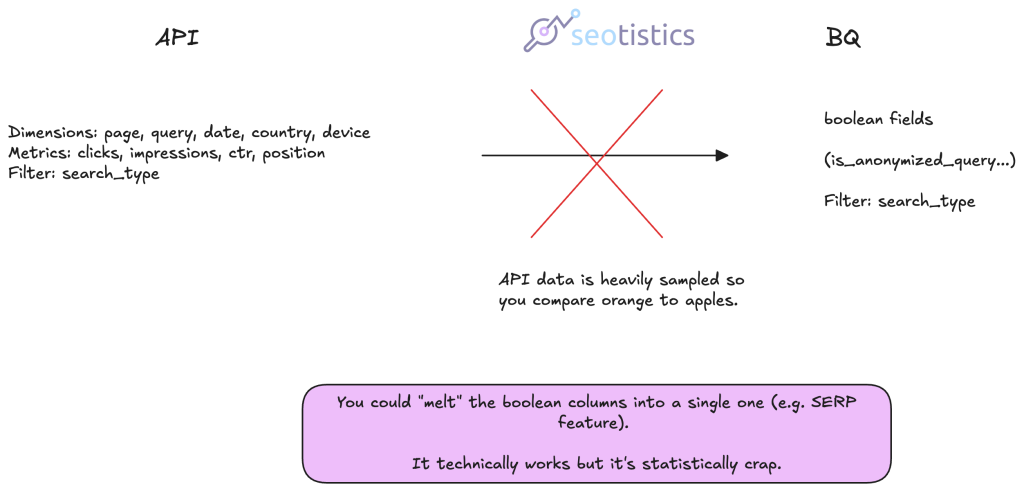
There are several reasons, including:
- API data is incomplete (missing anonymized queries)
- BigQuery data is complete (includes anonymized queries)
- You’re comparing two different data universes
Real example of what happens:
January 2024 (API data): 150,000 queries
February 2025 (BigQuery data): 250,000 queries

YoY comparison shows: +66% growth!
But this isn’t real growth, you’re just seeing the difference between incomplete (API) and complete (BigQuery) data.
Which Data Source Should You Use?
Always BigQuery if given the choice, not only it’s cheap or free for small websites, it’s mandatory for larger websites.
If you need historical analysis, BigQuery can’t help you and you must use the API.
This is what happens for most projects before BigQuery is set up correctly.
All of the headaches illustrated in this article disappear completely and you don’t need to pay for any tool.
The issue of working with APIs is that you have to build your pipeline and handle the API limits.
SQL Examples to Validate Discrepancies
Let me give you practical SQL queries you can run to see these discrepancies yourself.
N.B. I put placeholder dates in some queries, feel free to edit them.
1. Count Anonymized Queries
SELECT
  COUNT(DISTINCT CASE WHEN is_anonymized_query THEN query END) as anonymized_queries,
  COUNT(DISTINCT CASE WHEN NOT is_anonymized_query THEN query END) as visible_queries,
  COUNT(DISTINCT query) as total_queries,
  ROUND(COUNT(DISTINCT CASE WHEN is_anonymized_query THEN query END) / COUNT(DISTINCT query) * 100, 2) as pct_anonymized
FROM `project.dataset.searchdata_url_impression`
What this shows: How much data you’re missing if you only use UI/API.
2. Compare Site vs URL Table Impressions
-- Site table total
SELECT
  'Site Table' as source,
  SUM(impressions) as total_impressions
FROM `project.dataset.searchdata_site_impression`
WHERE data_date = '2025-02-13'

UNION ALL

-- URL table total
SELECT
  'URL Table' as source,
  SUM(impressions) as total_impressions
FROM `project.dataset.searchdata_url_impression`
WHERE data_date = '2025-02-13'
What this shows: How much impression inflation occurs from multi-ranking pages.
3. Find Queries with Clicks But No Data in UI
SELECT
  query,
  SUM(clicks) as clicks,
  SUM(impressions) as impressions,
  ROUND(SUM(clicks) / SUM(impressions) * 100, 2) as ctr
FROM `project.dataset.searchdata_url_impression`
WHERE clicks > 0
GROUP BY query
ORDER BY clicks DESC
-- LIMIT 1000 OFFSET 1000 -- uncomment this line to get row 1001-2000
What this shows: Valuable queries driving traffic that you’d never see in the UI. Mind you, you either download the output as a CSV or scroll down or edit the query to show from row 1001.
4. Pages with Traffic Not in UI Top 1,000
SELECT
  url,
  SUM(clicks) as clicks,
  SUM(impressions) as impressions,
  COUNT(DISTINCT query) as unique_queries
FROM `project.dataset.searchdata_url_impression`
WHERE data_date BETWEEN '2025-02-01' AND '2025-02-13'
GROUP BY url
HAVING SUM(clicks) > 0
ORDER BY clicks DESC
What this shows: Pages generating clicks that are invisible in UI due to the 1,000 row limit, same as above, you may want to scroll down or change the query.
The Change Starts Now
GSC data discrepancies are often minor ones and don’t severely affect your reporting WITH due exceptions.
The UI gives you a quick snapshot, the API gives you programmable access and BigQuery gives you the complete picture.
The real mistake is treating them as interchangeable.
Pick the right source for the question you’re asking and never combine API and BigQuery data in the same analysis unless you know exactly what you’re doing.
If you’re working with a large website, BigQuery is the only serious option.
