Dataform is a handy tool to model your data and make it usable inside BigQuery.
There is no extra cost and it’s quite fast for smaller projects or if you are staying inside Google Cloud.
The only downside is that the first setup of Dataform isn’t intuitive and I struggled with it in the past.
I will teach you how you can do it yourself, as long as you have some familiarity or previous exposure to BigQuery and SQL.
We will combine GA4 and GSC data as an example, since this is a quite common and valuable use case.
P.S. This guide will be updated again soon with more details 👀
Table of Contents
What Dataform Actually Is
BigQuery is Google’s cloud data warehouse where you store massive tables there and run SQL on them.
GA4 can export raw events automatically.
Dataform is a free tool inside BigQuery which transforms raw data into clean, structured tables you can query and visualize.
It works in SQLX, a SQL dialect with configuration blocks and JavaScript logic.
It gives you version control for your SQL, automatic dependency resolution and built-in scheduling.
| Dataform | DBT | |
|---|---|---|
| Ecosystem | Google-native, integrated with BigQuery | Cloud-agnostic, works across warehouses |
| Cost | Free | Paid plans above the free tier |
| Templating | SQLX + JavaScript | SQL + Jinja |
| Best when | You’re all in on Google Cloud, want a quick start | You need the same tool across different environments |
| My verdict | Simpler, faster to set up, my preference for web analytics | The industry standard, but more setup for BigQuery-only teams |
So Dataform excels when you are going to stay inside Google Cloud, namely smaller projects OR pieces of a pipeline.
The Example You’ll Build
One row per URL per day, with clicks and impressions from GSC and unique users from GA4.
| date | url | users | clicks | impressions | ctr |
|---|---|---|---|---|---|
| 2026-08-28 | /blog/dataform-guide/ | 321 | 89 | 1420 | 6.3 |
| 2026-08-28 | /services/ | 288 | 21 | 560 | 3.8 |
Those are sample numbers, your real table will look like this.
Unique users don’t appear directly in the daily table and they are tricky to calculate, unlike the total clicks for GSC.
GA4 needs a special structure for that, an HLL sketch, which you’ll see in the staging layer. The all-time table turns that sketch into a real number, tot_unique_users.
Before you start, you need:
- GA4 BigQuery export enabled. Raw events land in sharded tables named events_YYYYMMDD, one per day. I recommend checking my article on GA4 data modeling.
- GSC data in BigQuery. Either the official export or your own pipeline.
- A Google Cloud project with the BigQuery and Dataform APIs enabled.
- Basic SQL. You don’t need to be a data engineer.
The project is about a dozen files. We’ll go through them by layer.
Step 1: Set Up The Project
Create a Dataform repository in the BigQuery console. Give it a name, pick a region, and let it create the repository.
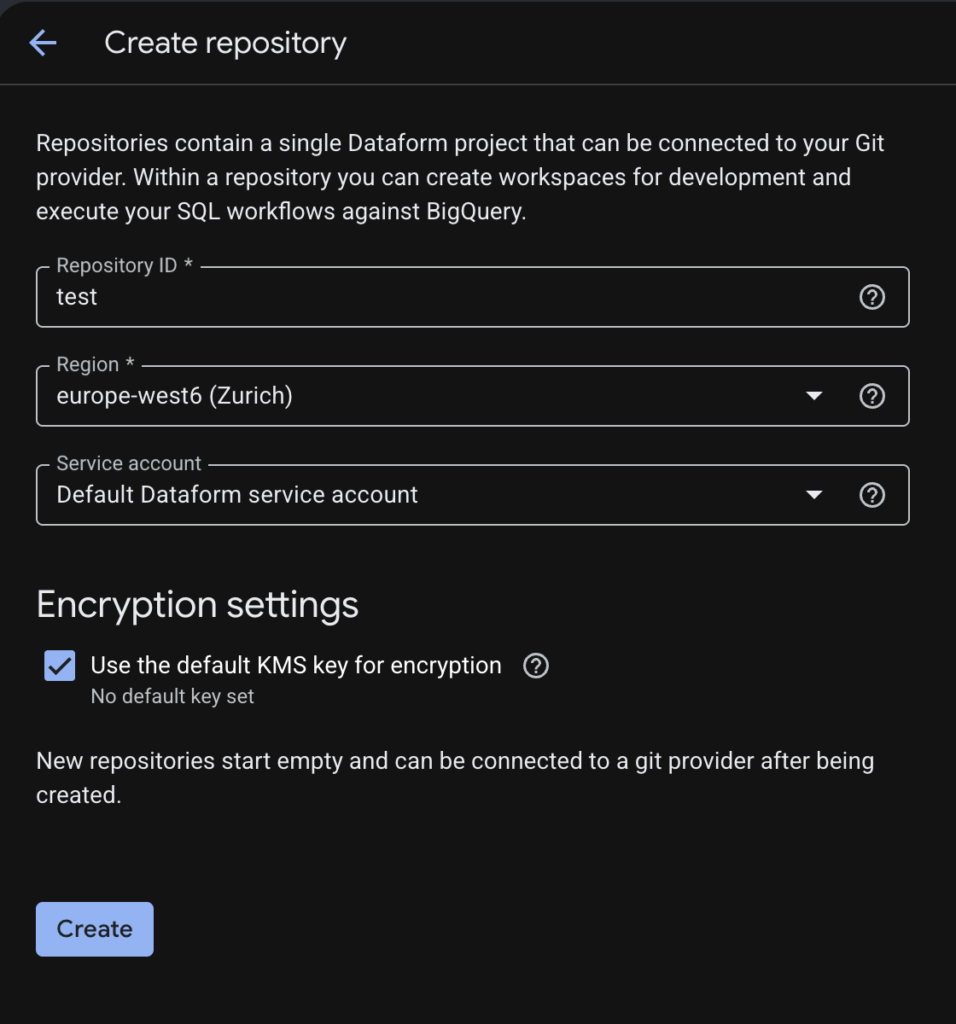
Then click below the red circle “Create development workspace”.
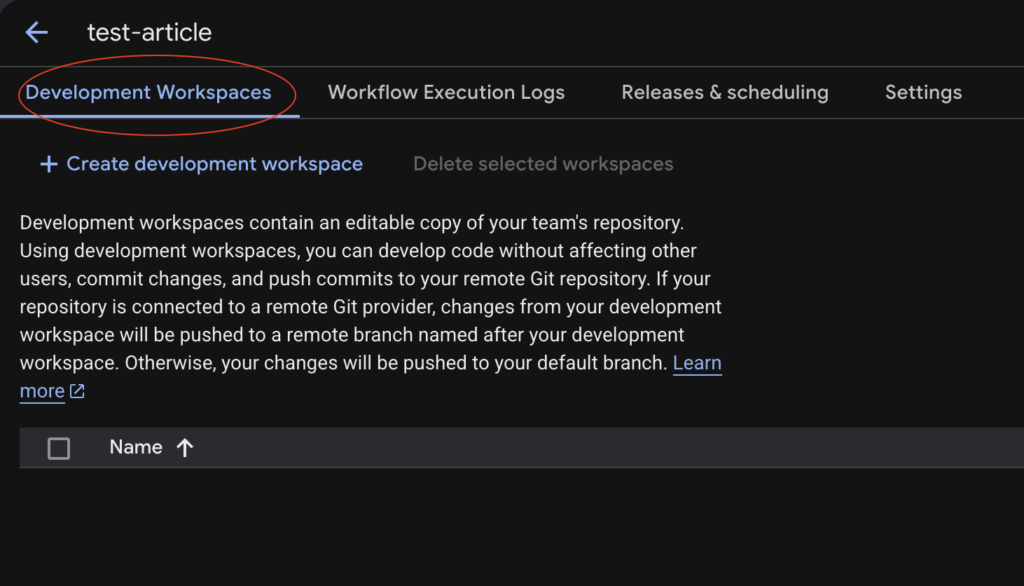
Development workspaces are where you do your actual work; they sync with Git later. You can name it how you want, it doesn’t matter.
Once the workspace is open, create these folders and files in the Files pane. Right click to create folders, then create files inside them. Dataform does not scaffold them for you.
workflow_settings.yaml
package.json
includes/
  constants.js
definitions/
  sources/
    declarations.js
  staging/
    stg_ga4_table.sqlx
    stg_gsc_table.sqlx
  marts/
    url_table.sqlx
    url_table_daily.sqlx
  tests/
    ctr_range.sqlx
    data_freshness.sqlx
    no_dupe_records.sqlx
    no_neg_values.sqlx
    no_null_keys.sqlx
One note: the output tables are never created by hand.
Dataform creates them in BigQuery automatically the first time you run the project, inside the dataset you set as defaultDataset.
The workflow_settings.yaml file holds project settings:
defaultLocation: europe-west6
defaultProject: <YOUR_GCP_PROJECT_ID>
defaultDataset: <YOUR_DEFAULT_DATASET_NAME>
defaultAssertionDataset: <YOUR_ASSERTIONS_DATASET_NAME>
vars:
  GA4_DATASET: <YOUR_GA4_DATASET_NAME>
  GA4_EVENTS_DATASET: <YOUR_GA4_EVENTS_DATASET_NAME>
  LOCAL_TIMEZONE: Europe/Zurich
  GSC_DATASET: <YOUR_GSC_DATASET_NAME>
Replace the placeholders with your values:
- defaultProject is your Google Cloud project ID.
- defaultDataset is where Dataform materializes your output tables, e.g. dataform.
- defaultAssertionDataset is where test results go, e.g. dataform_assertions.
- GA4_DATASET is the dataset with your raw GA4 export.
- GA4_EVENTS_DATASET is the dataset with a clean GA4 events table. More on that in Step 2.
- GSC_DATASET is the dataset with your Search Console export.
- LOCAL_TIMEZONE sets how Dataform interprets dates. Pick yours.
package.json pins the Dataform core version so updates don’t surprise you:
{"dependencies": {"@dataform/core": "3.0.2"}}Why this structure matters: sources point at tables you don’t own.
Staging cleans raw data, marts hold business logic and tests check the output.
Every layer has one job, so when something breaks you know exactly which file to open.
Step 2: Declare Your Data Sources
Sources tell Dataform which external tables exist. No SQL here, just declarations.
The project declares three sources in a single JavaScript file, definitions/sources/declarations.js:
declare({
    database: dataform.projectConfig.defaultProject,
    schema: dataform.projectConfig.vars.GA4_DATASET,
    name: 'events_*',
});

declare({
    database: dataform.projectConfig.defaultProject,
    schema: dataform.projectConfig.vars.GA4_EVENTS_DATASET,
    name: 'ga4_events',
});

declare({
    database: dataform.projectConfig.defaultProject,
    schema: dataform.projectConfig.vars.GSC_DATASET,
    description: 'Google Search Console URL impression data',
    name: "searchdata_url_impression"
});
dataform.projectConfig.vars reads the values you set in workflow_settings.yaml, so the same file works across projects.
Change the dataset names in one place and every reference follows.
The asterisk in events_* matters.
GA4 exports one table per day, events_20260801, events_20260802 and so on. The wildcard tells BigQuery to read them all as one table.
One note on ga4_events: the staging layer reads from a clean GA4 table, not the raw shards.
If you already have a sessionization layer that produces one (GA4Dataform builds one for you), point GA4_EVENTS_DATASET at it.
If you only have the raw export, point GA4_EVENTS_DATASET at the same dataset as GA4_DATASET and set the declaration name to events_* in the staging file instead.
Step 3: Build The Staging Layer
Staging files clean raw data, so one file for each source. According to best practices, light transformations only, no joins, no business logic.
You’ll see schema: “staging_test” in the configs.
That’s a sandbox name from my testing setup.
Rename it to whatever dataset you want the staging tables to land in or drop the line entirely and let defaultDataset from workflow_settings.yaml decide.
stg_gsc_table.sqlx rolls up Search Console to page and date:
config {
  type: "incremental",
  schema: "staging_test",
  description: "Google Search Console performance data by page URL and date",
  tags: [dataform.projectConfig.vars.GSC_DATASET, "gsc", "staging"],
  uniqueKey: ["url", "data_date"],
  bigquery: {
    partitionBy: "data_date",
    clusterBy: ["url"]
  },
  columns: {
    data_date: "Date of the search console data",
    url: "The page path from Search Console",
    clicks: "Total clicks from search results",
    impressions: "Total impressions in search results"
  }
}

pre_operations {
  ${when(incremental(),
    `DELETE FROM ${self()} WHERE data_date >= DATE_SUB(CURRENT_DATE(), INTERVAL ${constants.DATA_IS_FINAL_DAYS} DAY)`,
    `SELECT 'not incremental, no delete'`
  )}
}

WITH checkpoint AS (
  SELECT ${when(incremental(),
    `COALESCE(MAX(data_date), DATE('${constants.GA4_START_DATE}'))`,
    `DATE('${constants.GA4_START_DATE}')`
  )} AS date_checkpoint
  ${when(incremental(),
    `FROM ${self()}`,
    ``
  )}
)

SELECT
  data_date,
  REGEXP_REPLACE(url, r'https?://[^/]+', '') AS url,
  SUM(clicks) AS clicks,
  SUM(impressions) AS impressions
FROM
  ${ref("searchdata_url_impression")}
  ${when(incremental(), `, checkpoint`, ``)}
WHERE
  ${when(incremental(),
    `data_date > checkpoint.date_checkpoint`,
    `data_date >= DATE('${constants.GA4_START_DATE}')`
  )}
  AND search_type = 'WEB'
  AND url NOT LIKE '%#%'
GROUP BY
  data_date, 2
The GSC export has one row per query, page and date.
This file rolls it up to page and date, the grain we need for the join.
It also strips the protocol and domain from the URL, keeps only web search results and drops URL fragments.
stg_ga4_table.sqlx is where the GA4 magic happens:
config {
  type: "incremental",
  schema: "staging_test",
  description: "GA4 sessions and users by URL and date (truly unique per date)",
  tags: [dataform.projectConfig.vars.GA4_DATASET, "ga4", "staging"],
  uniqueKey: ["url", "event_date"],
  bigquery: {
    partitionBy: "event_date",
    clusterBy: ["url"]
  },
  columns: {
    event_date: "Date of the events",
    url: "The page path from GA4 events (page.path)",
    user_hll_sketch: "HLL++ sketch for unique users on this date (mergeable)"
  }
}

pre_operations {
  ${when(incremental(),
    `SELECT 'stg_ga4_table: incremental run'`,
    `SELECT 'stg_ga4_table: full-refresh'`
  )}
}

WITH checkpoint AS (
  SELECT ${when(incremental(),
    `COALESCE(MAX(FORMAT_DATE('%Y%m%d', event_date)), '${constants.GA4_START_DATE.replace(/-/g, "")}')`,
    `'${constants.GA4_START_DATE.replace(/-/g, "")}'`
  )} AS date_checkpoint
  ${when(incremental(),
    `FROM ${self()}`,
    ``
  )}
)

SELECT
  event_date,
  page.path AS url,
  HLL_COUNT.INIT(user_pseudo_id) AS user_hll_sketch
FROM ${ref("ga4_events")}, checkpoint
WHERE FORMAT_DATE('%Y%m%d', event_date) > checkpoint.date_checkpoint
  AND page.path IS NOT NULL
  AND (page.referrer IS NULL OR LOWER(first_user_traffic_source.source) NOT LIKE '%trafficheap.com%')
GROUP BY event_date, url
2 ideas make this file interesting:
HLL_COUNT.INIT builds an HLL++ sketch of unique user IDs instead of a plain count.
A sketch is a compact estimate that you can merge with other sketches.
That’s the right tool for GA4: it lets you answer how many unique users visited a page on a single day AND across any date range, without rescanning raw events.
COUNT(DISTINCT) can’t do that cheaply.
The checkpoint pattern controls incrementality.
On the first run, Dataform builds the full table from the start date in constants.js. On later runs it reads the latest event_date already in the table and only processes what’s newer.
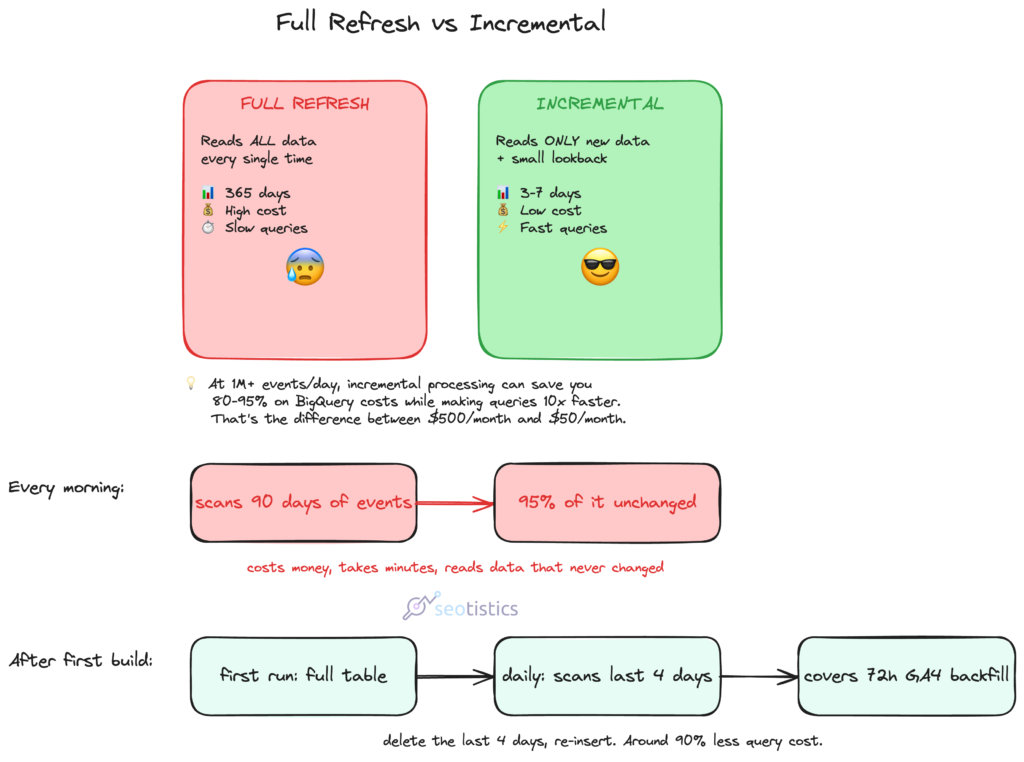
Combined with the 3-day delete window in the GSC staging file, this covers the GA4 backfill problem.
Google can deliver events up to 72 hours late, so you delete the last few days and re-insert them.
The constants live in includes/constants.js:
const GA4_START_DATE = "2020-01-01";
const DATA_IS_FINAL_DAYS = 5;

module.exports = { GA4_START_DATE, DATA_IS_FINAL_DAYS };
Change GA4_START_DATE if you don’t want to backfill that far, and DATA_IS_FINAL_DAYS matches the backfill window you trust.
One trap to know before you schedule this: the incremental window is measured from today, not from the data you already have.
If the pipeline stops running for longer than DATA_IS_FINAL_DAYS days, the window finds nothing to process.
The run succeeds, the tables don’t move, and the dashboard quietly stops updating.
Nothing breaks loudly, which is why the freshness assertion in Step 5 exists.
Fix it with one full refresh from the console, and keep DATA_IS_FINAL_DAYS at 5 or 7 so a missed day or two doesn’t lock the pipeline.
Note what’s NOT in this layer: no joins, no business rules.
If GA4 changes its schema, you fix one file because everything downstream reads from staging.
Step 4: Build The Marts
The marts join the staging tables and turn them into tables you can actually query. The project builds two.
url_table_daily.sqlx is the one row per URL per day table:
config {
  type: "incremental",
  schema: "marts_test",
  description: "Daily GA4 and Search Console data by URL",
  tags: ["reporting", "daily"],
  uniqueKey: ["date", "url"],
  bigquery: {
    partitionBy: "date",
    clusterBy: ["url"]
  },
  columns: {
    date: "The date of the data",
    url: "The page URL",
    clicks: "Daily clicks from search results (GSC)",
    impressions: "Daily impressions in search results (GSC)",
    user_hll_sketch: "HLL++ sketch for unique users (mergeable for arbitrary time ranges)",
    ctr: "Daily click-through rate (clicks/impressions)"
  }
}

pre_operations {
  ${when(incremental(),
    `SELECT 'url_table_daily: incremental run'`,
    `SELECT 'url_table_daily: full-refresh'`
  )}
}

SELECT
  COALESCE(gsc.data_date, ga4.event_date) AS date,
  COALESCE(gsc.url, ga4.url) AS url,
  IFNULL(SUM(gsc.clicks), 0) AS clicks,
  IFNULL(SUM(gsc.impressions), 0) AS impressions,
  MAX(ga4.user_hll_sketch) AS user_hll_sketch,
  SAFE_DIVIDE(IFNULL(SUM(gsc.clicks), 0), IFNULL(SUM(gsc.impressions), 0)) * 100 AS ctr
FROM (
  SELECT data_date, url, clicks, impressions
  FROM ${ref("stg_gsc_table")}
  ${when(incremental(), `WHERE data_date >= DATE_SUB(CURRENT_DATE(), INTERVAL ${constants.DATA_IS_FINAL_DAYS} DAY)`)}
) gsc
FULL OUTER JOIN (
  SELECT event_date, url, user_hll_sketch
  FROM ${ref("stg_ga4_table")}
  ${when(incremental(), `WHERE event_date >= DATE_SUB(CURRENT_DATE(), INTERVAL ${constants.DATA_IS_FINAL_DAYS} DAY)`)}
) ga4
  ON gsc.data_date = ga4.event_date
  AND gsc.url = ga4.url
WHERE COALESCE(gsc.data_date, ga4.event_date) IS NOT NULL
GROUP BY 1, 2
Three ideas do the work:
FULL OUTER JOIN keeps URLs that only exist in one dataset. A page with clicks but no GA4 rows still shows up, and vice versa. COALESCE fills the missing side.
IFNULL turns missing metrics into 0 instead of null, so the table is safe for dashboards.
SAFE_DIVIDE computes CTR without drawbacks, even though this is optional. Impressions by definition should always be larger than 0!
Incremental mode only touches the last few days on each run, gated by when(incremental()).
On the first run it builds the full table. On every later run it rebuilds the window that Google could still backfill.
url_table.sqlx is the all-time version.
One row per URL with total clicks, impressions, CTR and tot_unique_users. This is where the HLL sketch becomes a real number:
config {
  type: "table",
  schema: "marts_test",
  description: "Combined GA4 and Google Search Console data for comprehensive page performance analysis",
  tags: ["reporting", "combined"],
  bigquery: {
    clusterBy: ["url"]
  },
  columns: {
    url: "The page URL",
    tot_clicks: "Total clicks from search results (GSC)",
    tot_impressions: "Total impressions in search results (GSC)",
    ctr: "Click-through rate (clicks/impressions)",
    tot_unique_users: "Total unique users from GA4 (HLL++ estimate)"
  }
}

WITH gsc_aggregated AS (
  SELECT
    url,
    SUM(clicks) AS tot_clicks,
    SUM(impressions) AS tot_impressions
  FROM ${ref("stg_gsc_table")}
  GROUP BY url
),

ga4_aggregated AS (
  SELECT
    url,
    HLL_COUNT.MERGE(user_hll_sketch) AS tot_unique_users
  FROM ${ref("stg_ga4_table")}
  GROUP BY url
)

SELECT
  COALESCE(gsc.url, ga4.url) AS url,
  IFNULL(tot_clicks, 0) AS tot_clicks,
  IFNULL(tot_impressions, 0) AS tot_impressions,
  SAFE_DIVIDE(IFNULL(tot_clicks, 0), IFNULL(tot_impressions, 0)) * 100 AS ctr,
  ga4.tot_unique_users
FROM gsc_aggregated gsc
FULL OUTER JOIN ga4_aggregated ga4
  ON gsc.url = ga4.url
WHERE COALESCE(gsc.url, ga4.url) IS NOT NULL
HLL_COUNT.MERGE combines the daily sketches into one estimate per URL.
You get an accurate unique user count for any period without ever running a COUNT(DISTINCT) on raw events.
Step 5: Protect It With Tests
Silent pipelines break quietly without you noticing and sometimes nobody checks dashboards.
The project ships five assertion files in definitions/tests/.
Assertions run as part of every execution. If one fails, the run fails loudly and you get notified instead of a wrong dashboard.
ctr_range.sqlx checks that click-through rate stays between 0 and 100 in both marts:
config {
  type: "assertion",
  description: "Ensure CTR is between 0 and 100 in all reporting tables"
}

SELECT
  'url_table' AS table_name,
  url,
  CAST(NULL AS DATE) AS date,
  ctr
FROM ${ref("url_table")}
WHERE ctr < 0 OR ctr > 100

UNION ALL

SELECT
  'url_table_daily' AS table_name,
  url,
  date,
  ctr
FROM ${ref("url_table_daily")}
WHERE ctr < 0 OR ctr > 100
data_freshness.sqlx fails when staging data is older than 3 days (or whatever range you want), so you notice a broken export immediately:
config {
  type: "assertion",
  description: "Ensure staging tables have been updated within the last 3 days"
}

SELECT
  'stg_gsc_table' AS table_name,
  MAX(data_date) AS max_date
FROM ${ref("stg_gsc_table")}
HAVING max_date < DATE_SUB(CURRENT_DATE(), INTERVAL 3 DAY)

UNION ALL

SELECT
  'stg_ga4_table' AS table_name,
  MAX(event_date) AS max_date
FROM ${ref("stg_ga4_table")}
HAVING max_date < DATE_SUB(CURRENT_DATE(), INTERVAL 3 DAY)
The other 3 files follow the same pattern:
- no_dupe_records.sqlx catches duplicate keys in both marts.
- no_neg_values.sqlx fails when clicks, impressions or users go negative, which happens when a backfill corrupts data.
- no_null_keys.sqlx ensures the primary keys in staging are never null.
An assertion works like a query that should return nothing.
If any row comes back, Dataform fails the step.
That’s why a broken mart is worse than no mart at all: a missing table is a visible signal, wrong data is invisible.
Step 6: Run, Schedule And Connect Data Studio
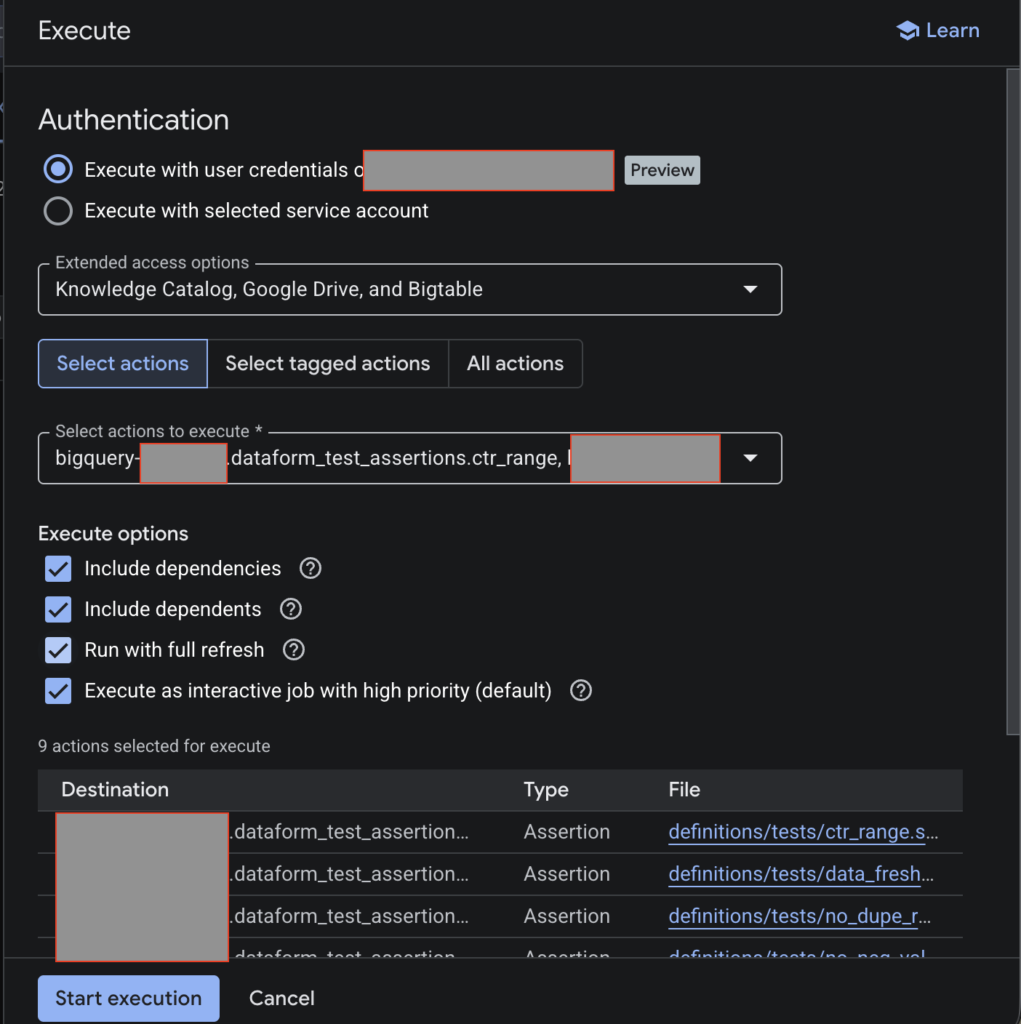
Run the project once to build everything. In the Dataform console, compile and execute.
You can also assess whether it went all well:
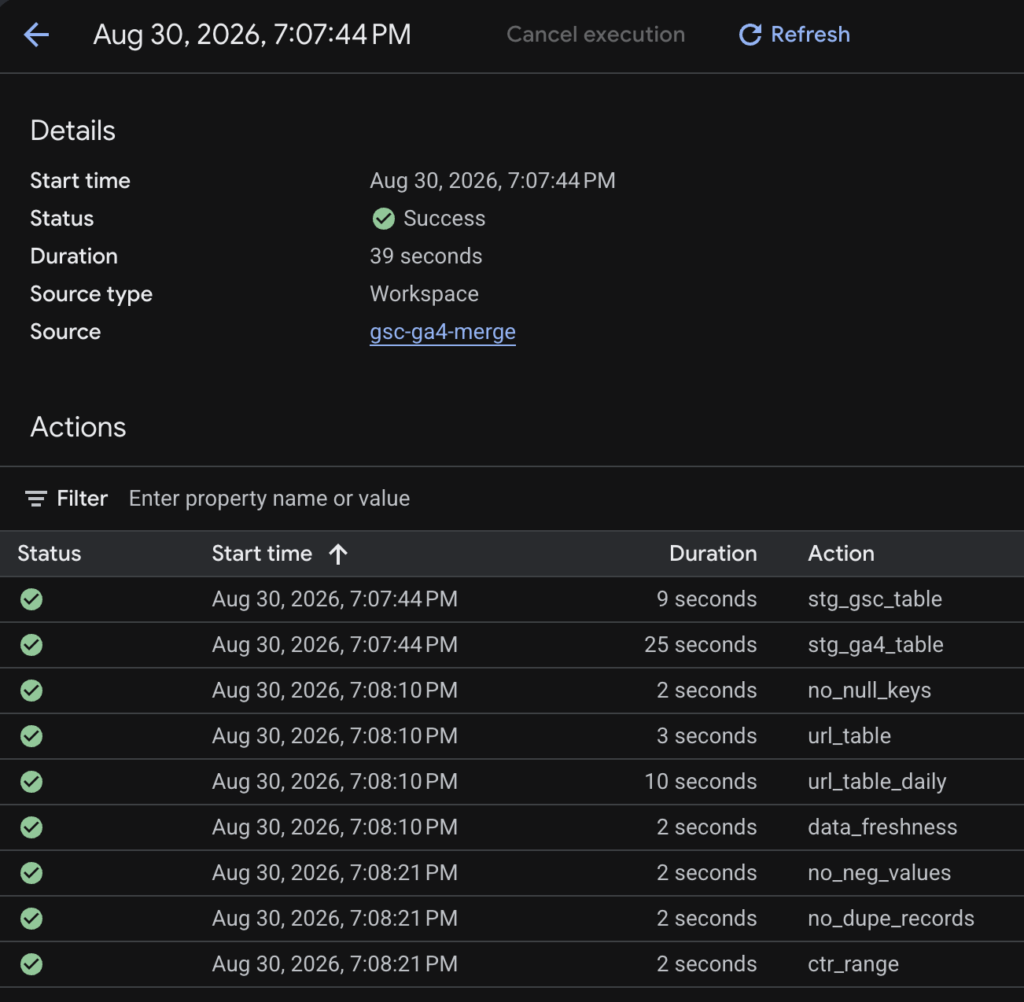
The tables will appear in your BigQuery dataset, finally!
Then set a schedule. Dataform runs the whole graph on its own, in dependency order.
Daily is right for GA4 and GSC data so this exact use case.
Then, you can consider testing in visualization tools like Data Studio.
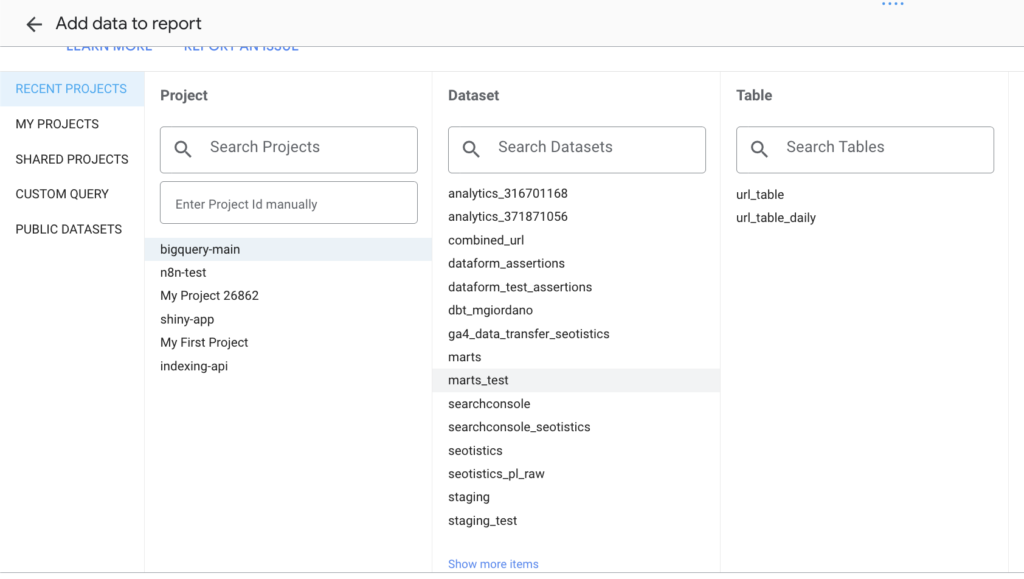
Add BigQuery as a data source, pick url_table_daily or url_table, build your report. One row per URL per day, ready to visualize.
Step 7: Deploy To Production With Git And Schedules
The schedule you set in step 6 runs the pipeline but it’s not all because we need to finalize it!
Production needs 3 more pieces: Git, a release configuration and a workflow configuration.
First, connect the repository to Git. Git is version control: it tracks every change to your code, so you can undo mistakes and see what actually changed.

Dataform connects to GitHub, GitLab, Bitbucket or Azure DevOps through Developer Connect, Google’s service for linking repositories.
Your development workspace becomes a branch. Production reads from main, so nothing reaches the pipeline until you merge.
Then create a release configuration, namely a bridge between code and production.
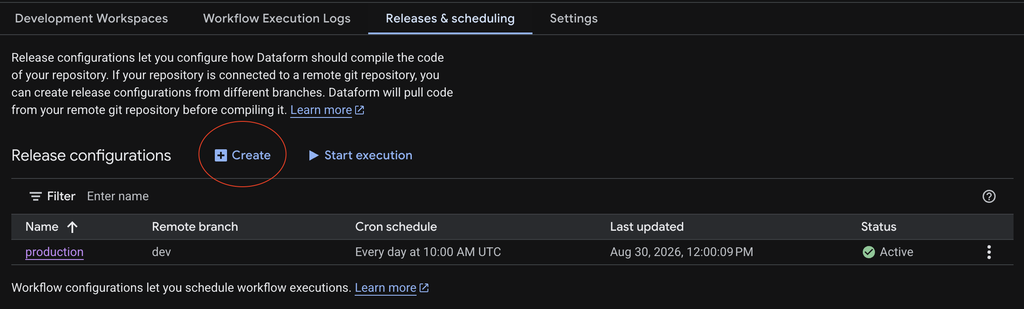
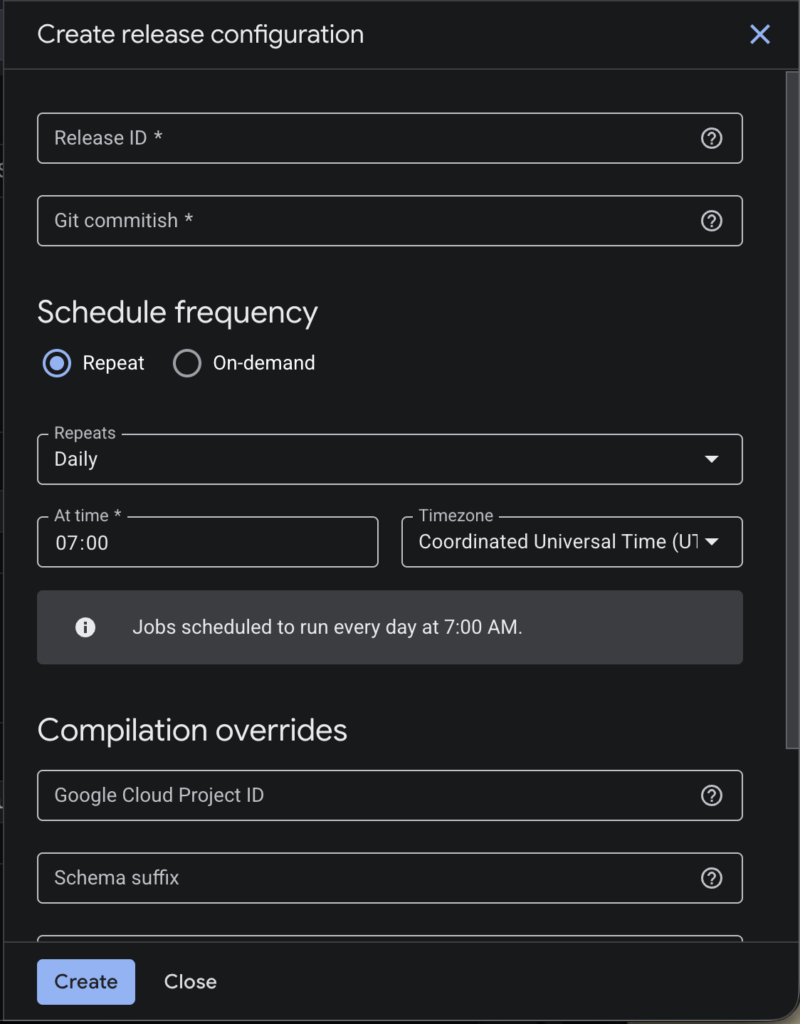
You point it at the main branch and set how often it compiles, once again daily for this pipeline.
Each compile produces a compilation result, a validated snapshot of the code at that moment. That snapshot is what production runs.
The workflow configuration is where you set the schedule. You pick the release configuration, set the run time and timezone, add notifications.
06:00 UTC works for GA4 and GSC. The graph runs in dependency order, the same order ref() resolved back in step 3.
A failed run sends you an email or a Slack message instead of failing silently.
The full flow:
- You push a change to main
- Dataform compiles it
- The schedule fires
- The graph runs
- Assertions gate the marts
If something breaks, the run fails and you get the notification before anyone looks at a dashboard.
Keep the deployment as small as the pipeline. One release configuration and one workflow configuration are enough for a web analyst.
Where To Build It: An IDE, Not The Browser
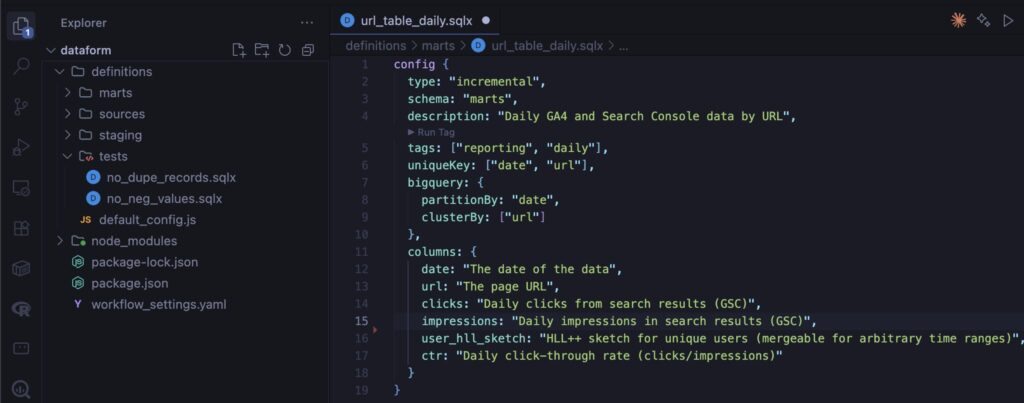
Dataform works from the BigQuery console but it’s not as efficient as working from an IDE.
Antigravity is a good example and a VisualStudio fork by Google.
Connect your GitHub repo and get LLM integration that works with Claude Code, for example. You also get some Gemini usage, even though it’s not that good.
Proper Git workflows, branches, diffs that make sense. Find and replace across the whole repo.
Some Notes On The Modeling
The project in this guide is the same shape I set up in client projects.
Sources, staging, marts, tests. The only difference is that sometimes you would see intermediate layers for more serious projects.
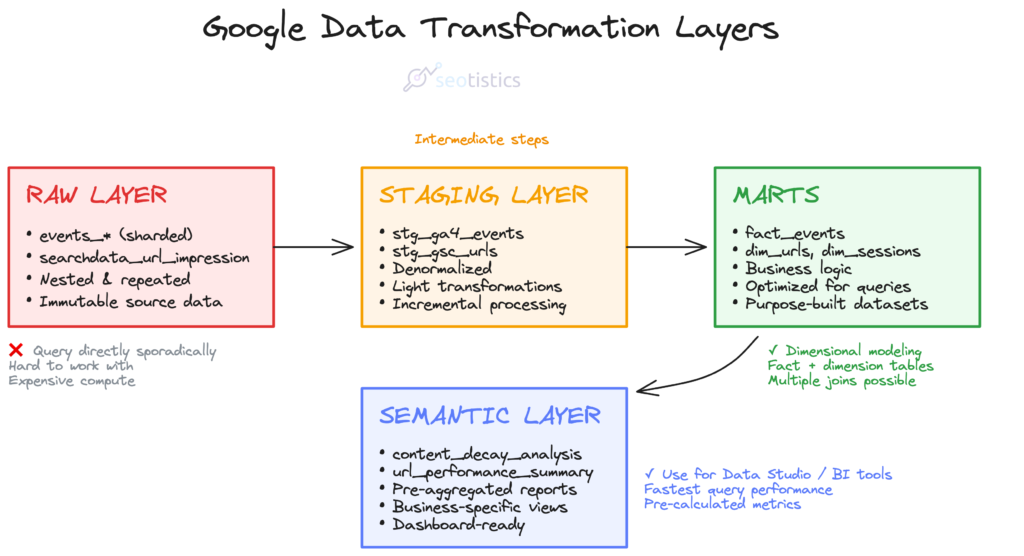
Or even semantic layer aka dedicated marts which are more specific.
And if you want to learn more about this and practical use cases, plus 1:1 support, I have the dedicated course for you: