Google Analytics 4 data modeling is an underrated topic…
yet one of the most important things to do if you want a serious Analytics project to succeed.
After working with it for quite some time, I will share my learnings with you on how to transform the data so that it’s usable.
P.S. I am an Analyst, not an Engineer, so don’t expect too many technicalities, we focus on the business logic here.
Don’t expect clustering, partitioning or benchmarks, it’s mostly concepts and some sample SQL code.
Table of Contents
Ok… What is a Data Model?
A data model is a way of organizing your data and shows you how they relate to each other.
No, this has nothing to do with GTM or tracking, it’s about how data is connected.
You can’t work on serious projects without an understanding of your data model.
There are many ways to proceed and not a universal rule on this topic and I will show you the pros and cons of each.
Before we start, it’s important to understand the 3 levels of data modeling:
- Conceptual: data the business needs and relationships between different concepts, no technical implementation.
- Logical: specific attributes for each entity, primary and foreign keys, and normalize the structure. You’re still database-agnostic at this point.
- Physical: Actual implementation, type selection.
If you are a novice, don’t worry about these 3 concepts for now, just read the article 1-2 times.
For all the others, we will only focus on the first 2 levels as I am not an engineer.
The Change From Universal Analytics
For those who didn’t adapt yet, Universal Analytics (UA) used a session-based model and GA4 is using an event-based one.
In plain English, this means everything is an event for GA4 and each of them has multiple parameters, i.e. attributes that define an event.
If you are still thinking in terms of UA, your knowledge is completely outdated.
This new model affected how data is presented in the BigQuery export.
In this article we will talk about the events_* table, which is the baseline for GA4.

As discussed previously in my article about GA4 and GSC with their BigQuery differences, there is a lot to untangle.
The events table you get is not actually one, there are as many tables as days.
You see that number in brackets? It tells you how many days you have in your data.
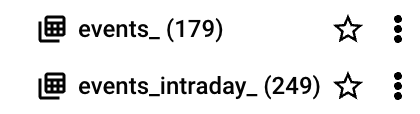
Every day is a shard, a separate table containing data for that day.
As a recap, here is the GA4 schema in BigQuery for the events table:

The OBT (One Big Table) Approach
This is the default approach if you don’t touch the GA4 BigQuery export and simply use it.
It means having one big table (as the name hints) that will be used for all of your calculations.
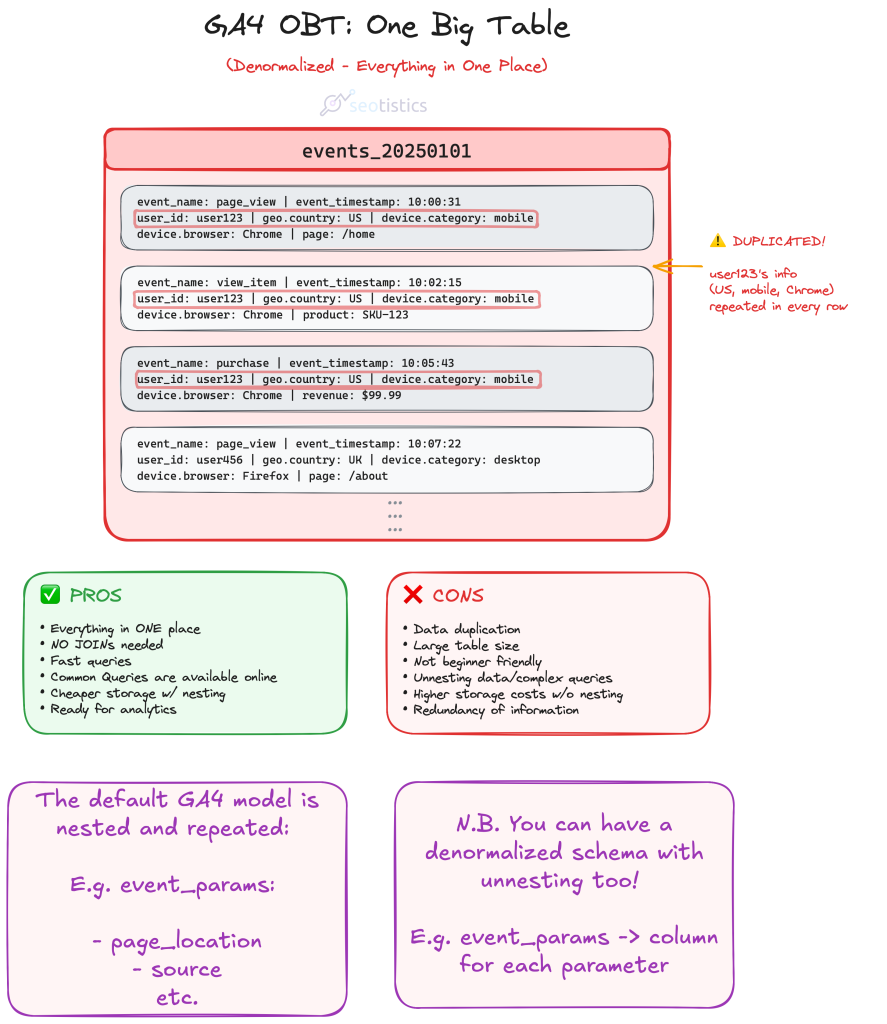
While this approach looks nice on paper, it’s terrible in practice:
- changing some values takes time
- hard to write queries
- you don’t need all of that in one tablel
I mostly discourage this approach with GA4 for clarity reasons.
If you’ve already read my article on GSC and GA4 BigQuery, you would know that GA4 uses a nested and repeated schema.
This is great for storage, as you save more money, but terrible for compute.
Since storage nowadays is cheap and compute is not, it’s better to consider alternative approaches like the next one.
The issue is that it’s hard to work with this schema because you are required to write SQL horrors like the one below:
Example: calculate total users by page

WITH page_user_combinations AS (
  SELECT
    (
      SELECT
        value.string_value
      FROM
        UNNEST(event_params)
      WHERE
        event_name = 'page_view'
        AND key = 'page_location'
    ) AS page_location,
    user_pseudo_id
  FROM
    `project_name.dataset_name.events_*`
  WHERE
    _TABLE_SUFFIX BETWEEN FORMAT_DATE('%Y%m%d', DATE_TRUNC(CURRENT_DATE(), MONTH))
    AND FORMAT_DATE('%Y%m%d', DATE_SUB(CURRENT_DATE(), INTERVAL 1 DAY))
  GROUP BY
    page_location,
    user_pseudo_id
)

SELECT
  page_location,
  COUNT(DISTINCT user_pseudo_id) AS total_users
FROM
  page_user_combinations
GROUP BY
  page_location
Imagine having to write all of that just to answer simple requests…
Now answer, how can you even use that schema for consumption in Looker Studio? You don’t!
Joe Reis, one of the authorities for Data Engineering, covered the issue of OBT in one of this articles about data modeling myths.
Luckily not many professionals actually think this schema is ready for use but you would be surprised to see the opposite…
Nested & Repeated Schema
GA4 schema is defined as nested and repeated.
The struct groups columns together under a single record (nested), as you can see from the red line above.
The array allows you to have subrows (repeated), shown in the picture as the vertical list of event parameters.
This creates a subtable per each row and it’s quite confusing to work with them.
A record is a key-value pair, e.g. page_referrer is the key with a string value equal to https://search.aol.com/.
The good thing about the nested and repeated structure is that you save in storage… but you make super complex queries.
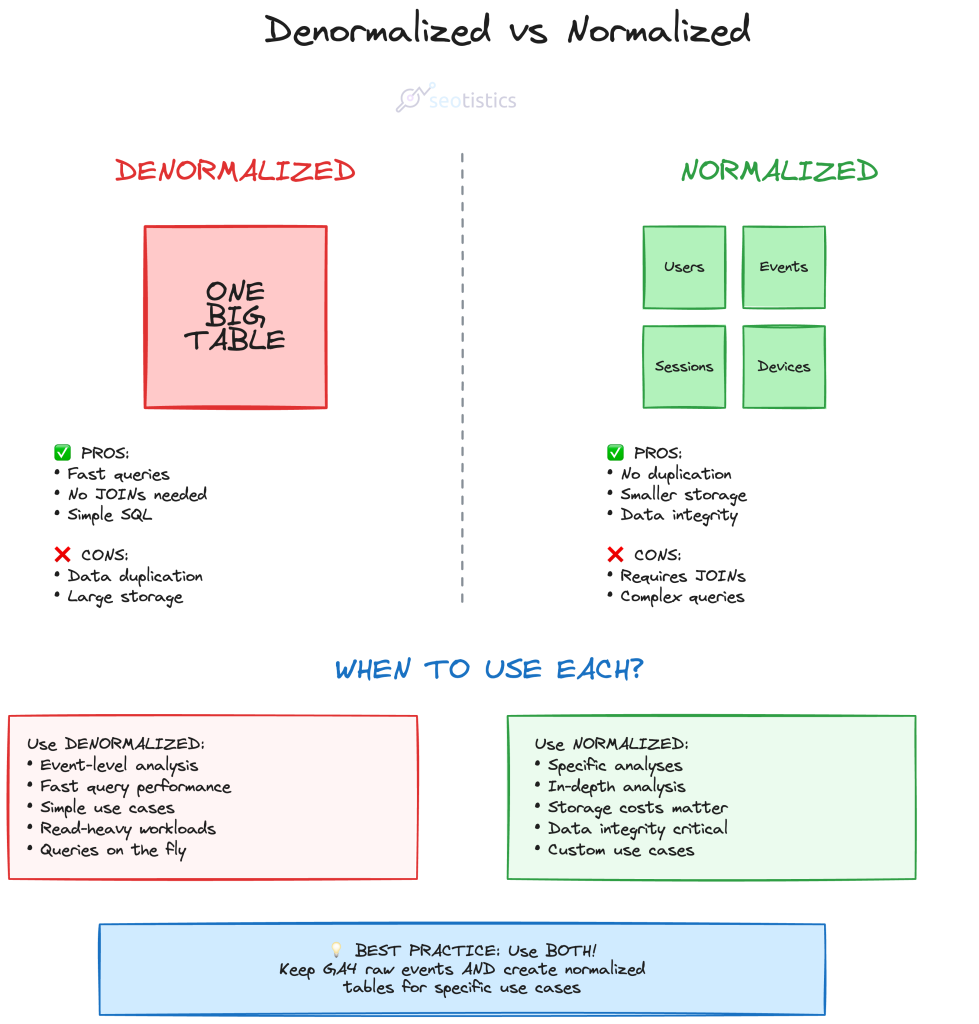
Denormalized – A Better Alternative
We also refer to this table as “denormalized”.
It means that our data is in a format where redundancy is allowed and it speeds up aggregations and calculations by reducing joins.
This is partially true in this case as we have nested and repeated data, as you just saw.
So a denormalized model doesn’t need to include these “nested” fields:
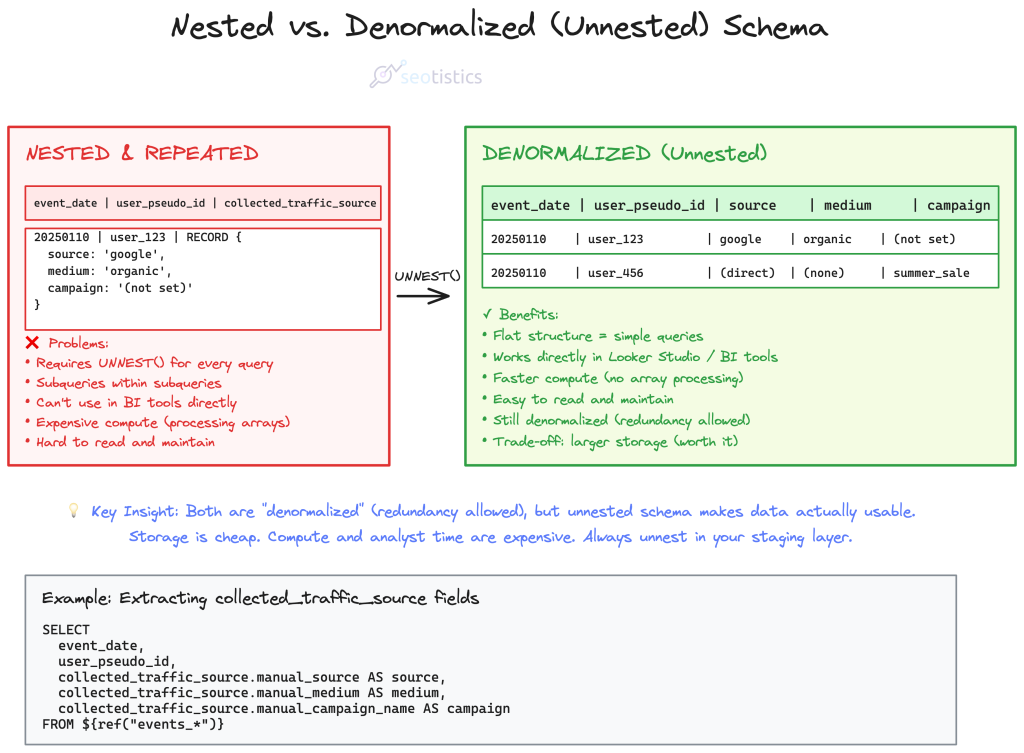
This is already much better than the standard export.
To summarize what we just said, consider these differences:
The Dimensional Schema (Normalization or Kimball)
This is one of my favorite approaches to GA4 modeling and it can be referred to with a lot of names.
It consists in defining which consists in organizing data into fact and dimension tables.
| Type | Description |
|---|---|
| Fact | Contains quantitative data, measures and timestamps. |
| Dimension | Contains attributes that qualify the fact table. |
My advice to make this exercise trivial is to think in terms of entities.
In terms of fact table, we know that events are the core concept and have timestamps.
Everything else is just another specification of events, so they constitute dimensional tables.
As a marketer, one of the entities I need at all costs is URL, since I want to measure how my pages are doing.
Then, you may notice that according to the GA4 model, you need to have user, session and event at least.
If you are an Ecommerce, you may also want to add transactions and all of your products/items.
What you come up with can look something like this:

where each entity is represented by a table and connected to other tables via relationships.
Every dimensional table is connected to the fact table (events) with a cardinality of 1:n.
It’s much easier to work with this model as you can just query the tables you are interested in.
For example, if you want to obtain the total number of users per page:
SELECT url, COUNT(user_id)
FROM dim__users
GROUP BY 1
ORDER BY 2 DESC
And if you need to filter by date, you are forced to go through the event table, containing this information:
SELECT
  u.url,
  COUNT(DISTINCT e.user_pseudo_id) AS total_users
FROM
  fact_events e
  INNER JOIN dim_url u ON e.url_id = u.url_id
WHERE
  e.event_date BETWEEN '2025-01-01' AND '2025-12-31'
GROUP BY
  u.url,
  u.page_title
ORDER BY
  total_users DESC
The real con of this approach is that you may need multiple joins which can slow down performance.
The Marketing Logic & Data Checks
As I said at the start of the article, I am an Analyst and my background is in SEO, Content and Marketing.
Engineers alone often make the “wrong” choices when it comes to modeling because they don’t know how we practitioners work.
For example, let’s say I need to improve my website or just see what’s content should stay, I’d need pages and queries.
What Marketing Actually Needs vs. What Engineers Build
✓ Marketing Needs
- URL table with traffic, conversions, content group
- Query table with impressions, clicks, positions
- URL + Query mapping for content optimization
- Source/medium/campaign for attribution
- Pre-calculated metrics (page performance, conversions)
Answer: “Which pages should I improve?” “What queries drive conversions?”
❌ Engineer Default
- Event table with billions of rows
- User table with device specs
- Session table with technical IDs
- Normalized to the extreme (10+ joins needed)
- No business context or calculated metrics
Answer: “Here’s all the data, figure it out yourself”
This is why you need to be involved in data modeling. Engineers optimize for technical purity. Marketers need fast answers to business questions.
this would be super hard to get without the appropriate tables!
Before you actually use these tables for production, check if the metrics and the breakdowns are actually correct.
This means comparing what you get in the pre-modeled tables to what you get in the final tables.
Possible Variations
Your entities will change depending on your business model and what you want to measure.
As a matter of fact, some don’t even report on a page level and prefer alternative approaches where the focus is more on events.
If you are dealing with an Ecommerce, you must figure out how deep you want to go with transactions and products.
Publishers who monetize with Display Ads may favor different entities, e.g. the publisher RECORD in BigQuery.
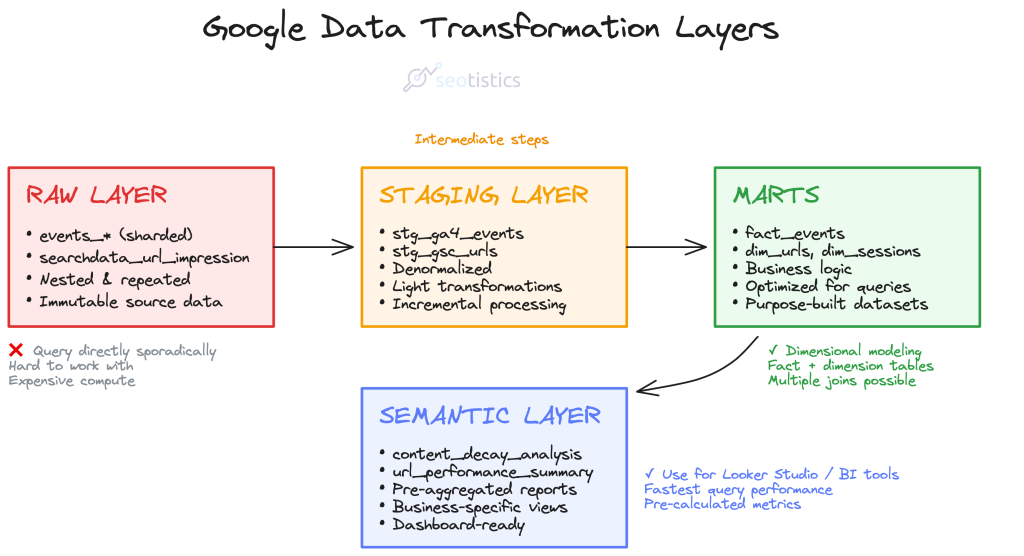
Different Layers
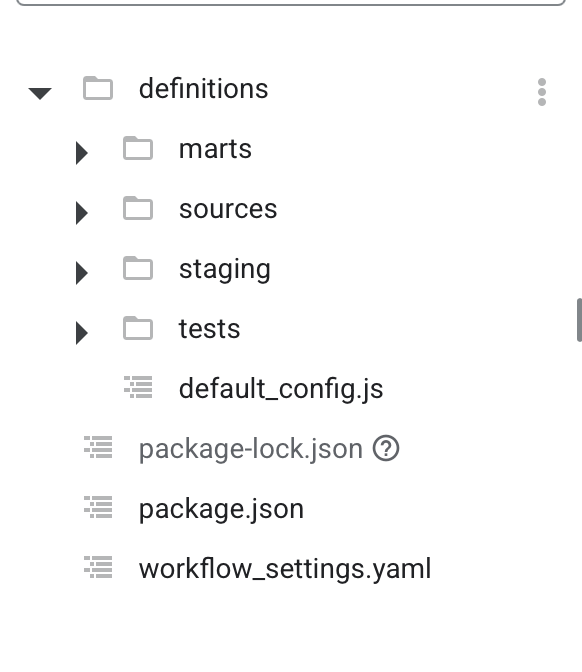
If you are slightly familiar with Dataform/DBT you know that data undergoes several transformations, ideally by layer:
| Layer | Example |
|---|---|
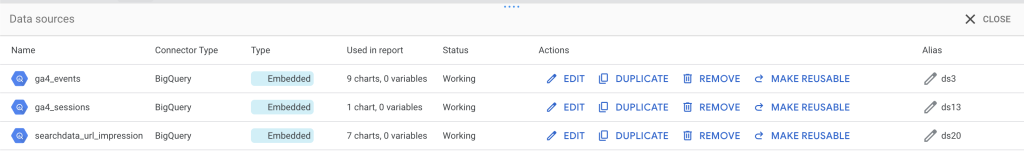
| Raw | events_* table, searchdata_url_impression |
| Staging | stg_ga4_urls, stg_gsc_queries |
| Mart | url_table |
| Semantic | url_performance_summary, content_effectiveness_report |
Which summarized means:
Raw Layer
The raw layer is where data lands exactly as it comes from source systems.
No transformations, no cleaning,just pure extraction.
The goal here is immutability and auditability.
You want to be able to trace back to exactly what the source system said at any point in time.
Common patterns include appending timestamps, keeping all records even if they’re duplicates, and preserving the original schema structure.
Using raw data is a terrible idea both for performance and clarity.
Staging Layer
This is your workspace for light transformations and standardization.
You’re doing things like casting data types correctly, renaming columns to consistent conventions, filtering out obvious junk records, and maybe doing some basic deduplication.
Here is a rookie example from what I use for my website:
ga4_events AS (
SELECT
 PARSE_DATE('%Y%m%d', REGEXP_EXTRACT(_table_suffix,'[0-9]+')) AS event_date,
(SELECT value.string_value FROM UNNEST(event_params) WHERE key = 'page_location') AS url,
 user_pseudo_id,
(SELECT value.int_value FROM UNNEST(event_params) WHERE key = 'ga_session_id') AS session_id,
 DENSE_RANK() OVER (
PARTITION BY REGEXP_EXTRACT(_table_suffix,'[0-9]+')
ORDER BY _table_suffix
) as tbl_suffix_nr
FROM ${ref("events_*")}, checkpoint
WHERE REGEXP_EXTRACT(_table_suffix,'[0-9]+') > checkpoint.date_checkpoint
QUALIFY tbl_suffix_nr = 1 -- Only take first suffix (avoids duplicates)
),

ga4_total_sessions AS (
SELECT
url,
 COUNT(DISTINCT CONCAT(user_pseudo_id, session_id)) AS sessions
FROM ga4_events
WHERE url IS NOT NULL
GROUP BY url
),

ga4_total_users AS (
SELECT
url,
 COUNT(DISTINCT user_pseudo_id) AS users
FROM ga4_events
WHERE url IS NOT NULL
GROUP BY url
),

ga4_dates AS (
SELECT DISTINCT
 event_date,
url
FROM ga4_events
WHERE url IS NOT NULL
)

SELECT
 gd.event_date,
 gd.url,
 gts.sessions,
 gtu.users
FROM ga4_dates gd
LEFT JOIN ga4_total_sessions gts ON gd.url = gts.url
LEFT JOIN ga4_total_users gtu ON gd.url = gtu.url
The staging layer is still pretty close to the source structure, but it’s cleaned up enough that downstream work becomes easier.
In Dataform, this is often where you’d use incremental models if you’re dealing with large datasets.
Marts
This is where business logic lives.
You’re joining tables, calculating metrics, aggregating to the grain that analysts actually need. Think of marts as purpose-built datasets for specific analysis needs.
This is another snippet of code I use for creating a mart:
WITH gsc_aggregated AS (
  SELECT
    url,
    SUM(clicks) AS tot_clicks,
    SUM(impressions) AS tot_impressions
  FROM ${ref("stg_gsc_table")}
  GROUP BY url
),

ga4_aggregated AS (
  SELECT
    url,
    MAX(users) AS tot_users,
    MAX(sessions) AS tot_sessions
  FROM ${ref("stg_ga4_table")}
  GROUP BY url
)

SELECT
  COALESCE(gsc.url, ga4.url) AS url,
  IFNULL(gsc.tot_clicks, 0) AS tot_clicks,
  IFNULL(gsc.tot_impressions, 0) AS tot_impressions,
  IFNULL(ga4.tot_users, 0) AS tot_users,
  IFNULL(ga4.tot_sessions, 0) AS tot_sessions,
  SAFE_DIVIDE(IFNULL(gsc.tot_clicks, 0), IFNULL(gsc.tot_impressions, 0)) * 100 AS ctr
FROM gsc_aggregated gsc
FULL OUTER JOIN ga4_aggregated ga4
  ON gsc.url = ga4.url
WHERE COALESCE(gsc.url, ga4.url) IS NOT NULL
You might have a “marketing_performance” mart that combines GA4 sessions with GSC clicks and ad spend, all rolled up to a campaign level with calculated metrics like conversion rate and ROAS.
Marts should be denormalized and optimized for querying, not for storage efficiency.
Semantic Layer
it’s a metadata layer that sits on top of your marts and defines business metrics in a consistent, reusable way.
Instead of every analyst writing their own SQL to calculate “active users,” the semantic layer defines it once.
We could also say this is composed of tables that are used to solve specific business problems, e.g. a content decay analysis:
| url | sessions | users | conversions | avg_time | decay_score |
|---|---|---|---|---|---|
| /blog/post-1 | 1,250 | 890 | 45 | 3:24 | 0.85 |
| /pricing | 3,100 | 2,400 | 210 | 1:45 | 0.92 |
| /blog/post-2 | 450 | 380 | 12 | 2:15 | 0.67 |
| /about | 890 | 720 | 8 | 1:30 | 0.78 |
The example above would be how you can make a semantic table look like.
In practice, you can also ignore the semantic step and just use marts.
Either way, the important is that you have tables that can be used in BI tools and help the business succeed.
Hybrid Solutions (Marts)
For specific data products (e.g. a dashboard), you may want to use the previous model and build other tables on top of it.
Yes because it’s not always possible to have multiple joins and have a performant product.
It happened to me to work with PowerBI and face this exact issue.
The data model was clear and correct but the performance was horrible.
So the call was to create pre-aggregated tables that are more performant and contain what we needed for specific visuals and tables.
For example:

The real downside is that this can degenerate super quickly as you keep creating preaggregated tables for specific use cases.
However, this is so far one of the best solutions in terms of compute and one I can safely recommend.
You should never use a full table (granular) in Looker Studio… process the data BEFORE it lands there!
Market Solutions
For simpler projects, there is no need to create your custom data model.
Tools like GA4Dataform and PipedOut can do the heavy lifting for you!
The paid tier of PipedOut follows a different approach that is quite similar to the 4-tier I described:
The staging tables are quite detailed (which is nice) and as said before, you would just use the marts.
From here, you can start building dashboards with Looker Studio or pull your data to build your data products.
So don’t be discouraged, in most cases, relying on existing solutions it’s 100% fine, the important is using your data, making decisions and driving action.
And last but absolutely not least, SEO Stack is a great tool to combine GSC and GA4 data.
The downside of it is that you don’t store the data yourself and the entire reason why you store data is to own it.
Dataform
Google BigQuery offers a FREE integrated solution named Dataform to transform your data.
You still pay for the compute cost of transforming your data BUT the tool per se is free of charge.
All of what I described can be covered within BigQuery!
This is me practicing with Dataform to create dedicated marts for my use cases.
The real limitation of Dataform is that it’s restricted to Google’s infastructure, unlike DBT or any other competitor.
But let’s be serious, it doesn’t matter for most projects and it’s remarkably easier than DBT.
Incrementality
A big topic in data modeling is whether you should use incremental tables.
Since we get daily GA4 data, it doesn’t make any sense to reprocess all of it every single day!
This process looks simple but it can get incredibly complex in terms of code and logic.
How do you even figure out how to identify the latest rows?
For GA4, there is a method outlined by Jules that works wonders and is also used inside GA4Dataform.
I applied a similar variant for GSC data as well and it just works.
This is an example for a staging table coming from the GSC URL table:
config {
 type: "incremental",
 schema: "staging",
 description: "Google Search Console performance data by page URL and date",
 tags: [dataform.projectConfig.vars.GSC_DATASET, "gsc", "staging"],
 uniqueKey: ["url", "data_date"],
 bigquery: {
 partitionBy: "data_date",
 clusterBy: ["url"]
 },
columns: {
 data_date: "Date of the search console data",
url: "The page URL from Search Console",
 clicks: "Total clicks from search results",
 impressions: "Total impressions in search results"
 }
}

pre_operations {
 ${when(incremental(),
`DELETE FROM ${self()} WHERE data_date >= DATE_SUB(CURRENT_DATE(), INTERVAL 4 DAY)`,
`SELECT 'not incremental, no delete'`
 )}
}

WITH checkpoint AS (
SELECT ${when(incremental(),
`COALESCE(MAX(data_date), DATE('2024-01-01'))`,
`DATE('2024-01-01')`
 )} AS date_checkpoint
 ${when(incremental(),
`FROM ${self()}`,
``
 )}
)

SELECT
  data_date,
  url,
  SUM(clicks) AS clicks,
  SUM(impressions) AS impressions
FROM
  ${ref("searchdata_url_impression")}
  ${when(incremental(), `, checkpoint`, ``)}
WHERE
  ${when(incremental(),
    `data_date > checkpoint.date_checkpoint`,
    `data_date >= DATE('2024-01-01')`
  )}
  AND search_type = 'WEB'
GROUP BY
  data_date, url
Google still applies changes to a dataset for the last 72 hours.
You don’t need to worry about this for small data but it’s necessary knowledge for modeling.
How To Process The Data
Actual analytics engineering means you will get what you need from the data and ignore the rest.
Do you actually need to have rows with useless events? Most likely not, so you can filter them out in your marts.
Real Life Examples
I want to show some high level and anonymized examples of how data modeling can help you.
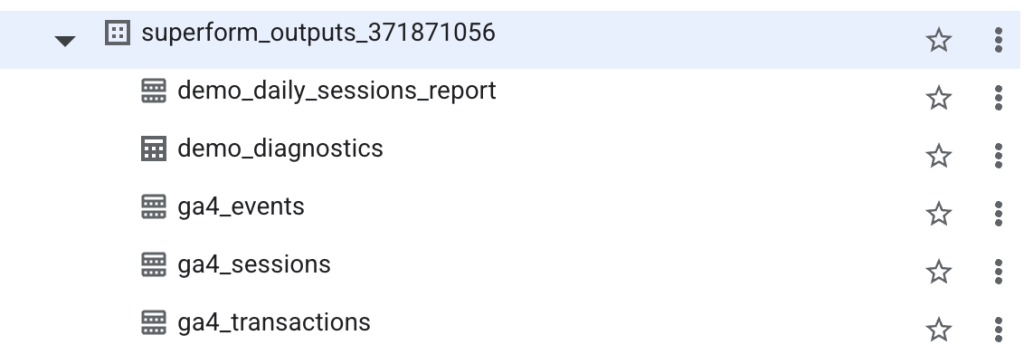
For small websites (like this one here), you can use GA4Dataform and solve a lot of issues quite easily.
This is what a small website can use, GA4Dataform + the base BQ table, minimal modeling:
In normal and even enterprise projects, things aren’t that simple.
You would want to combine GA4 data with your CRM or even other Google tools like Google Ads and Google Search Console.
Once again, the method you choose depends on the use case and size of data.
As long as you get something valuable that people use, anything goes.
If you don’t make it easier to work with data, then you are setting yourself up for failure, I am telling you.
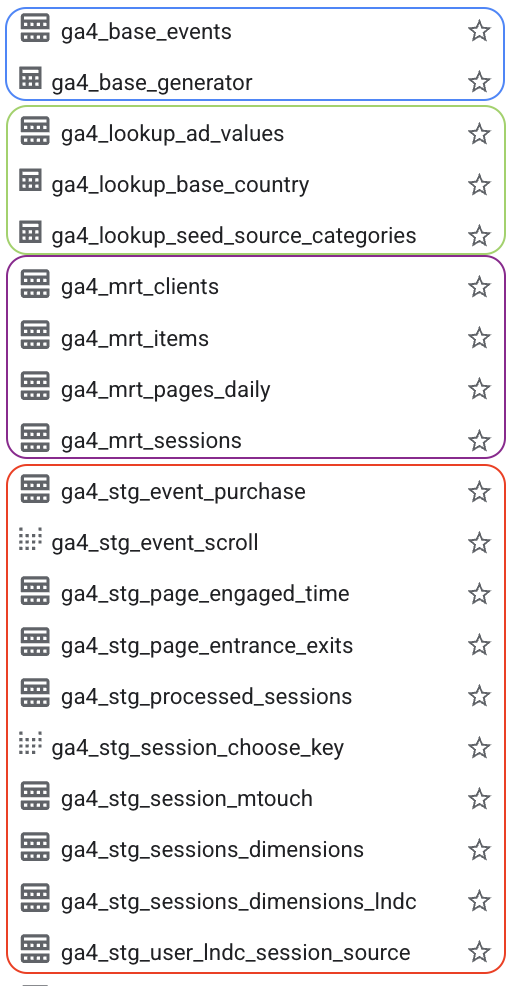
For an enterprise use case I worked on, we went for something like this:
An example for Large/Enterprise websites
GA4 + GSC Combined Mart
Business-enriched dimensional model. Combines engagement (GA4) with visibility (GSC) at the page level. Includes custom business dimensions for segmentation and reporting.
This is a denormalized mart with pre-joined business context. Custom dimensions added during transformation enable strategic analysis without complicating raw data collection.
GSC Keyword Performance
Query-level granularity with business enrichment. Time-series data for tracking keyword rankings and performance. Custom classification added for strategic SEO analysis.
Raw GSC is URL + query + date. Here we’ve added business logic (branded vs non-branded classification) that enables better SEO reporting.
Key modeling choice: Custom dimensions added in transformation layer, not in raw tracking. This keeps data collection simple while enabling complex business questions.
Of course it’s not ALL the fields, this is an exemplification.
This works wonders in most cases, it’s low maintenance and you don’t have to overthink it.
Common & Wrong FAQs
I have read too much misinformation on social media and this final section will address some of the most common points.
I never write FAQs because they are outdated but here we go.
“GA4 default schema shouldn’t be touched because of integrity”
This is absolutely false.
Converting the default schema to a more digestible format does NOT destroy your data or make it gibberish.
It just shows a very weak understanding of how data models work. The Google engineers that originally worked on the GA4 schema have no idea how your company works.
The reason why ANY data professional should know data modeling is that you actually understand how data works.
Many data professionals get blinded by the industry bubble and forget that they are not the end users of the products they build.
“My data is small, I don’t need modeling”
It’s so easy today with tools like GA4Dataform that you don’t even need to try.
There are 0 excuses to not do it and spend 5 minutes of your life for it.
The costs are either 0 or minimal too, don’t be lazy!
The main advantage is to make your life easier, not to just do this exercise because it’s cool.
“What if I want to use the API data or the Data Transfer instead?”
Then I wish you the best of luck because that’s processed data and defeats the entire purpose of using a warehouse.
I go over the reasons in my past article about GA4 and GSC differences in BigQuery.
To be short, raw data allow you to have full control over metrics AND you also get a FREE connector to ingest and store your data.
If you think this is a given, you have never used other data sources and spent months on pipelines.
This is amazing! Thank you for putting all this together.