
You have probably used Google Search Console (GSC) many times in the past but never went beyond the very basics.
Lucky you! In this article I explain how to interpret each metric (+ the data as a whole).
Table of Contents
Before We Start
If you haven’t checked my article on why BigQuery is different with GSC and GA4 data, this is the right time.
There I go over a lot of topics you may need to understand to get the most out of this article.
The best way to understand your metrics is to start from the rawest data available and do it backwards.
This will grant you unlimited mastery of SEO data and solid foundations for when you will prepare reports or automation.
P.S. The BigQuery code for most of the cool stuff in GSC is included in my FREE BigQuery Handbook, subscribe to my newsletter to get it now.
Clicks
Clicks tells you how many times your website was opened from Google Search.
This metric is quite straightforward and doesn’t have many surprises.
It can be used to gauge SEO results.
Click data is assigned to the canonical URL regardless of which URL the user actually visits, and redirects are followed to determine the final destination.
You can compare this metric to a traffic metric from GA4 but never use it alone to decide what to delete on your website.
According to Google, sessions would be the closest thing from GA4… it sounds reasonable but it’s not feasible.

Users is more conservative than Sessions and what I generally recommend to use. Still, the gap is quite big even when I filtered to have Google only.
P.S. Filter by session_traffic_source_last_click.manual_campaign.source = ‘google’ if you want to get the most accurate number. Also consider landing pages when joining for the most conservative estimates.
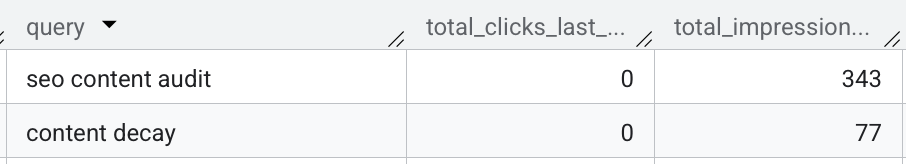
Since your website ranks for countless queries, most of them will have 0 clicks and that’s absolutely normal.
Impressions
Impressions tells you how many times your website was viewed from Google Search.
Impressions count each time your website appears on a loaded search results page, regardless of whether users scroll to see it.
Google calculates impressions when your link loads on the page, with exceptions for carousels and image search requiring actual visibility.
When multiple URLs from your property appear for the same query, aggregation by property counts this as one impression, while aggregation by page counts each URL separately.
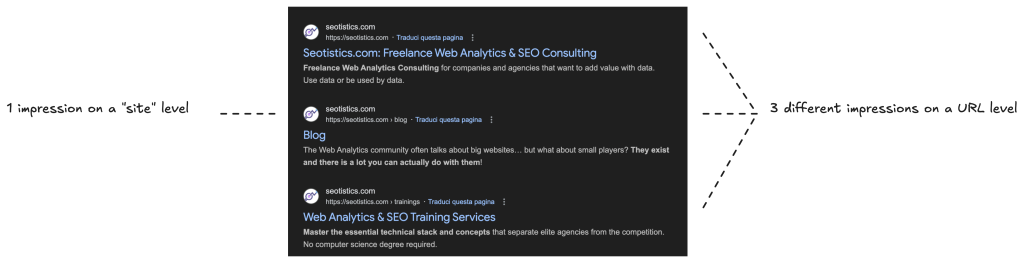
This aggregation method significantly affects your data interpretation.
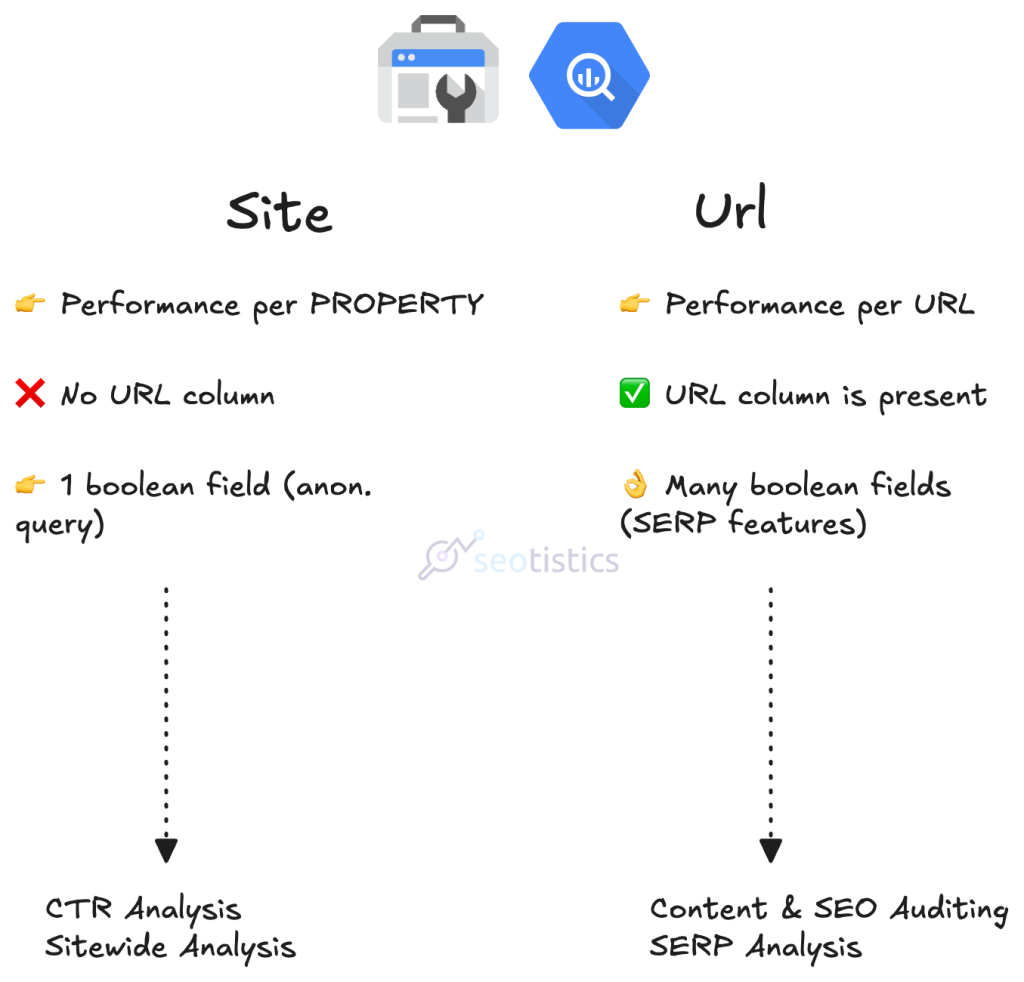
If you have used Looker Studio in the past you know it’s exactly like in BigQuery, you have 2 tables: site and url.
Here are the main differences:
You can use impressions as a proxy for visibility, although remember, it doesn’t mean people actually viewed your pages.
The best interest indicator is represented by branded searches instead:
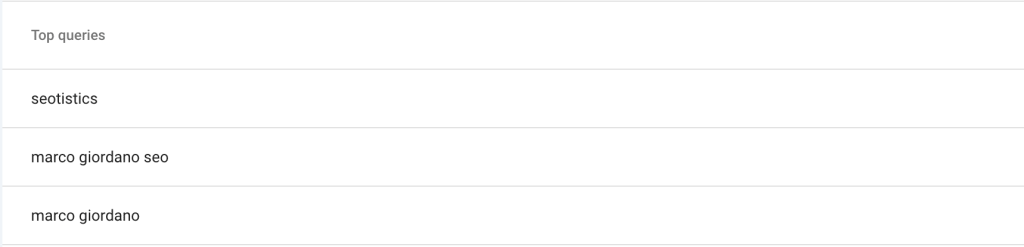
P.S. Every single row in GSC must have at least 1 impression to be recorded. There can’t be a row with 0 impressions.
BigQuery reports on anonymized queries too, not represented at all in the UI and even API.
Sometimes, the biggest discrepancy you will notice on larger websites with the UI is in terms of impressions.
Again, this doesn’t have any business impact and if you report on Impressions… your SEO reporting is quite wrong.
Impressions VS Search Volume
A common mistake is to confuse the 2 metrics.
Search Volume is NOT an official Google metrics and is a term coined by 3rd-party tools and based on estimates.
Google’s Keyword Planner uses Avg. Monthly Searches instead, containing a range of values, an approximation of how many people search in the specified area.
Some tools rely on those values for their estimates, otherwise they use Clickstream data, which tracks user behavior from tools and plugins.
All of this is also different from the values you see in Google Trends.
Without going too much into detail, each metric has a different story and use case that I won’t examine here, as it’s not that important.
Avoid comparing these metrics and/or relying on only one.
Clickthrough Rate (CTR)
CTR is the ratio of clicks and impressions, it tells you how many people clicked on your result.
Clickthrough Rate (CTR) = (Clicks/Impressions) * 100
A higher CTR is always good as you may imagine!
As the formula implies, a higher number of Impressions will lower your CTR.
Branded searches have a remarkably higher CTR due to the fact that you rank high and people are specifically looking for your brand.
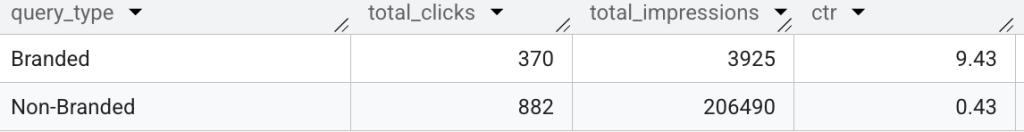
Here we are comparing the total CTR for branded queries vs non-branded ones. 9.4% is much larger than 0.4%!
You could also run a different analysis and inspect the median CTR per group or some other variation but the gist is the same.
This is the main reason why SEO efforts are gauged on non-branded keywords!
Branded performance skews your data but it’s still important to monitor since you would love people to directly type your brand name.
Average Position
Average position is a sketchy metric, like any average.
It’s the average of the positions for all the impressions.
Yes because a page can have different positions based on your searches, of course.
As shown by Google in their article, the position is assigned based on the pattern below:
From top to bottom of one side of the page, then to the other side and top to bottom.
We know how it’s actually calculated thanks to Google Documentation about the GSC BigQuery schema:
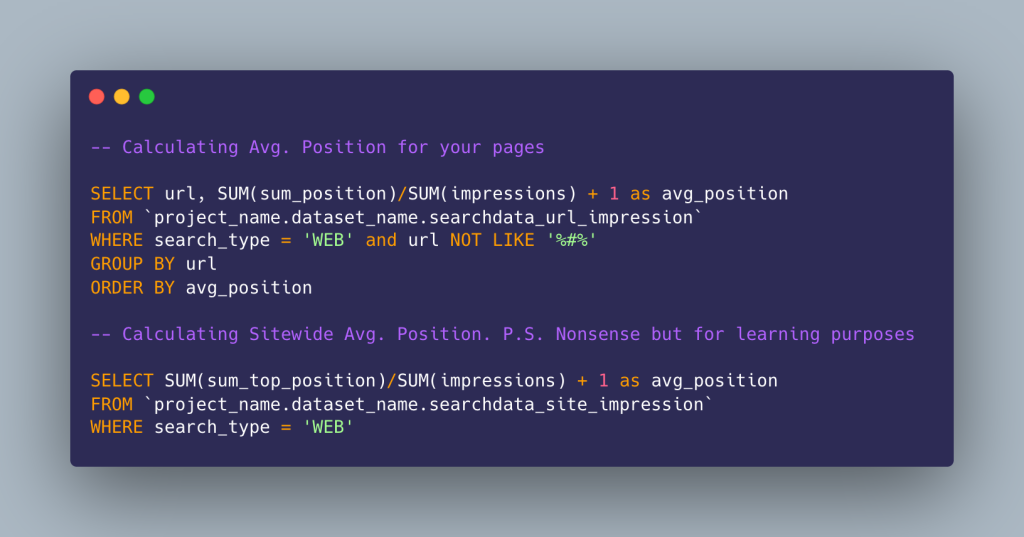
where sum_position/sum_top_position is a zero-based number indicating the topmost position of a URL in the search results for a given query.
This means the number starts from 0 (top position) and not 1.
Average Position is extremely misleading and this is why I prefer Pixel Ranking instead, as explained in my DataForSEO Handbook (subscribe to my newsletter to get it).

This measure tells you how much space you occupy rather than give you some random number.
If a SERP is filled with features and snippets, you may want to use this method.
If you really want to make some sense out of this metric, check Impressions and Unique Query Count.
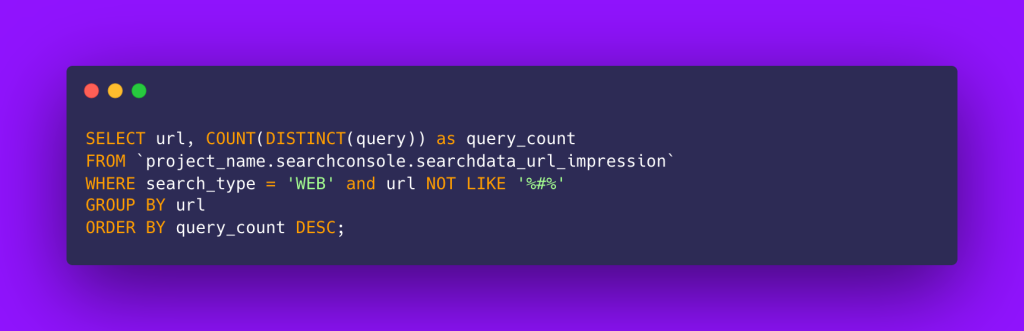
Unique Query Count (UQC)
This metric is NOT available by default in GSC, you can calculate it by counting the unique number of keywords for a given dimension, e.g. page.
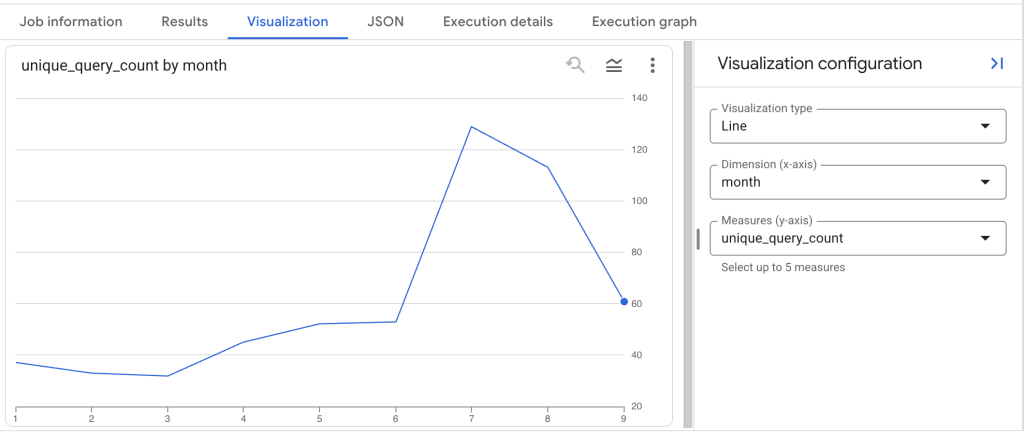
It’s another leading indicator like Impressions to show if you are going in the right direction.
An increase in UQC means you are expanding in terms of topics/variations you rank for.
A decrease in UQC isn’t always bad, depending on what you lost, much like Impressions. This is why you can dig deeper and build a table like the one below:
As shown above, losing the above queries didn’t alter my clicks profile (column 1 and 2) but I have to say that ranking for some of them would be beneficial!
Anyway, losing clicks is worse than impressions, as you may guess.
We can say this metric is more granular compared to Impressions and that’s why I prefer it.
The Future Of SEO Measurement?
While many relied on impressions and positions, Seotistics has always followed what proposed by some: query counting.
I find much more reliable to think in terms of keywords and count variations or see how they change over time.
Google has to figure out for what your pages are ranking and to do so, you can monitor your query variations 👀
Some “less aware” people claim that keywords are dead and we should think in terms of entities but that’s wrong because:
- Queries/keywords are your 1st-party data.
- Entities are arbitrary. Different tools will detect different entities. So this is NOT data.
The query data in GSC is super precious and worth much more than what proposed by tools, especially for the non-English markets.
Relationships/Common Situation
This guide wouldn’t be complete without some real-life examples of the most common scenarios you will face.
Low Clicks, High Impressions -> Low CTR
Your page doesn’t get enough clicks because of a conversion issue. Be sure to change the Title Tag or even gamble with your meta description.
This is even more true if you are sure you have a high position in the SERPs, as shown below.

You don’t even need to calculate the CTR to understand it’s 0% (no one clicks on you).
On a query level, this is the normal scenario for any website where you rank for unrelated or competitive keywords by default.

Some of them COULD be opportunities if you are sure you can target those queries.
Instead of manually checking all of those potential keywords, I recommend you perform Keyword Clustering, as show in my article.
The AI Exception
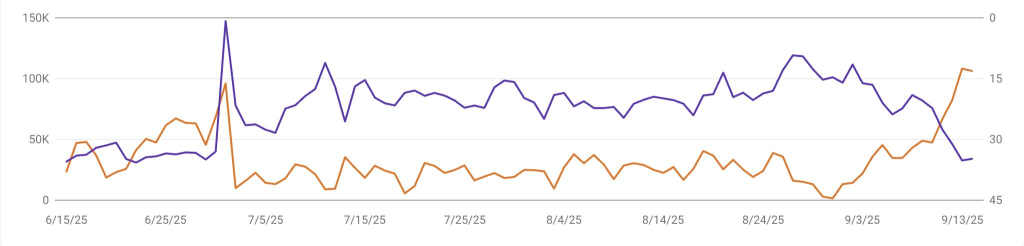
Recently, AI affected the impressions that websites get and some of them noticed a surge in impressions and a dip in clicks.
Mind you, this didn’t happen on ALL the websites.
On September 15, you may have noticed another trend after Google dropped the “&num=100” parameter skewing Avg. Position and Impressions in GSC.
Impressions down, Avg. Position insanely up.
This shouldn’t alter your measurement because both metrics don’t affect business performance.
Use them sparingly and rely on clicks when possible, you will have no issues.
High Clicks, High Avg. Position
This case is another example of Avg. Position being completely unreliable.
That’s because Google can display your content in some Knowledge panel or as a SERP feature and assign a different value than you think.

The example above is rare and one of the very few I’ve seen in my life with such bizarre values.
13.5 (orange color) is completely nonsense when shown to a non-technical user.
Growing Clicks, Decreasing Impressions/Avg. Position
This is good news as people are clicking more on your pages!
A drop in impressions/avg. position could mean that your page lost some high volume queries that didn’t matter in the first place.
Growing Unique Query Count (UQC), Decreasing Clicks
If a page starts ranking for more and more different queries, that’s often a good signal.
MInd you, a page normally ranks for completely unrelated queries or broad terms, so not all the increases in the UQC mean more money.
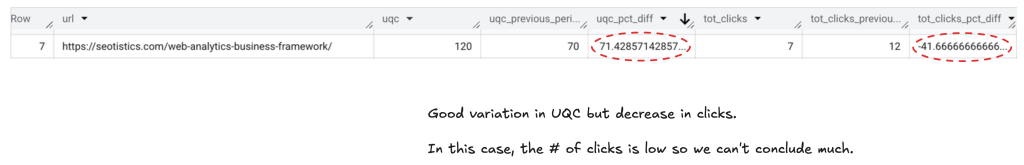
Still, analyzing your UQC over time by page can be important to see how many queries you are losing/gaining and if they are relevant.
If the number of queries goes up or stays consistent but clicks decrease, you may want to update your page or check your competitors.
Decreasing UQC, Decreasing Clicks and/or Avg. Position
This case is worse than the previous one because your page(s) lost queries or positions and clicks went down.
This is typical when there are SERP shifts and your content isn’t well aligned.
You may also lose important queries that are relevant to your page… that’s often what happens after specific Google updates.

As you can see above, the page lost unique queries (-34%) and also clicks (-63.8%). These are the effects of the HCU indeed.
What Is Missing
GSC as of now doesn’t allow you to isolate the AI Overviews and/or AI Mode data.
It’s included by default in your data, though.
You can’t get the actual traffic but at least you can rely on external services like DataForSEO to monitor your organic presence for those features.
Behavioral data and everything that happens inside your website is handled by other tools such as Google Analytics 4.
It’s important to know where to look, though, especially for big websites. My advice to detect the influence of AIO is to look for queries with low position (e.g. 1-3) and a reduction in clicks.
Then, you can verify your claims with other tools like DataForSEO to see if you were right or not.
If you want to learn more about this topic, I’ve prepared an Analytics for SEO course that covers both theory and practice:

Once you realize that GSC is just another tool of your SEO stack, it becomes much clearer that you can’t simply rely on its data alone.